PrevProcessWire 3.0.12 adds support for extended page names
ProcessWire 3.0.12 now supports the ability to use extended (UTF-8) page names, meaning your URLs can now have just about any characters that you want! More
This post is from 2016 and describes an older version of Tracy Debugger. Please visit the Tracy Debugger for ProcessWire website for the latest information.
Hi everyone, Adrian Jones here this week to give you a rundown on a relatively new module, TracyDebugger.
Primarily, it provides an easy way to install and configure Nette’s Tracy debug tool within your ProcessWire site, but it also extends it considerably with several custom panels, some of which are designed specifically for ProcessWire.
I have to warn you, this is a loooong post. I know many of you are already very familiar with this module, but hopefully there will still be some snippets of useful information for you.
Firstly, I want to send out a big thanks to @tpr for introducing me to Tracy and for the idea for this module and for significant feedback, testing, and feature suggestions. Many other forum members have also been instrumental in testing. I started listing them out, but it became too long and I didn't want to miss anyone, so a big general thanks to everyone – it has been a real community effort to get everything working on all systems. I’d especially like to thank all those users who provided tips in the support thread for setting up the editor protocol handler for their favorite code editor.
In keeping with the already considerable community involvement in this module, please let me know if you have ideas for other features that you'd like to see, or changes to existing ones.
We all know that debugging can sometimes take more time than coding.
The core Nette Tracy project helps you to:
Firstly, there is no need to choose one over the other. Tracy actually integrates nicely with Xdebug and there is even an add-on that integrates into the Tracy debug bar and enables you to easily start and stop a Xdebug session. I may include this with the module if there is demand.
While Tracy doesn't provide breakpoints/step through code functionality the way Xdebug does, it does provide a wide variety other features that I think make it a valuable tool, whether you use it in conjunction with Xdebug, or on its own. It is also a lot easier to install, especially if you need to debug something on a server where Xdebug is not supported.
Then there are all the ProcessWire specific panels that come with this module. The TracyDebugger module is much more than just a debugging tool.
I thought I'd start this tutorial with a real life example - in fact it is the reason I learned about Tracy. @tpr posted about a PHP Notice he was getting with my BatchChildEditor module - all he initially provided was:
PHP Notice: Trying to get property of non-object ... in Page.php:780
Not very helpful is it :) We know it's in the PW core Page.php file, but we don't know what is triggering it and I couldn't replicate it. Then he sent me the HTML of the Tracy debug output, which looked like the following (note - the call stack is truncated for brevity here):
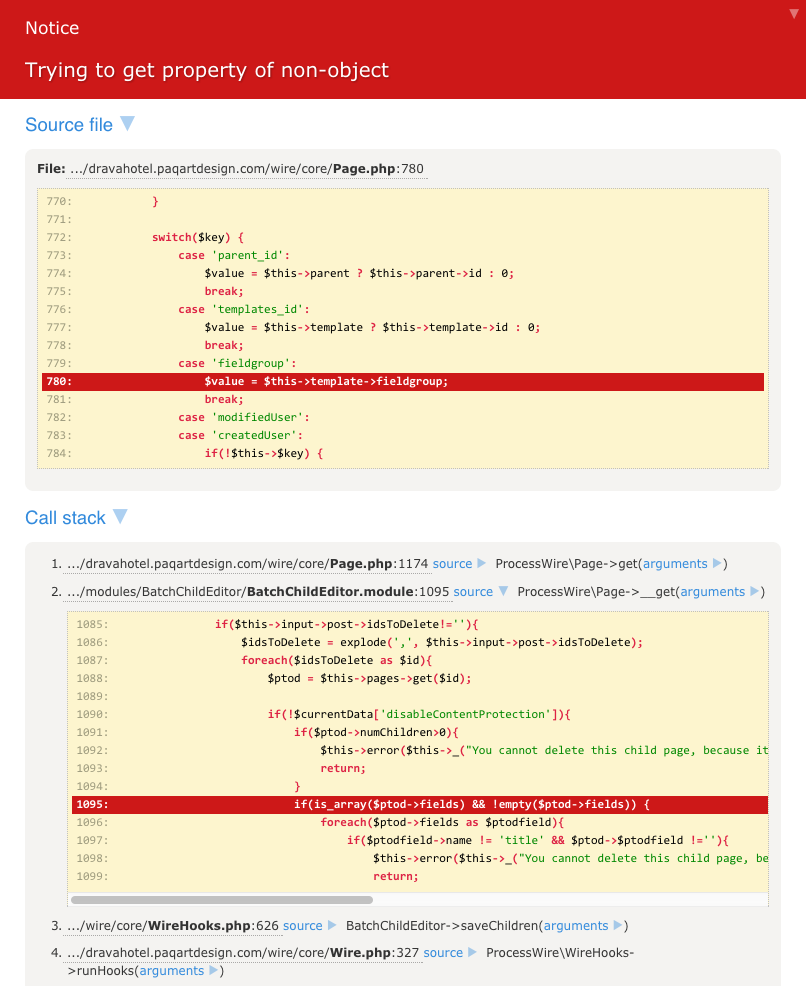
From this I could quickly see a call from line #1095 of BatchChildEditor.module, so I expanded that and could see the exact line. From there it only took a second to realize that my check for is_array() was insufficient because it needed to check that $ptod was a valid PW page object.
This also highlights one of the great things about Tracy - you can easily send someone the HTML of the rendered error page just be doing File > Save Page As in your browser - very handy when asking for support in the PW forums.
You can get started with Tracy by simply installing the module. Immediately you will see the debug bar on the front-end of your site. You can also enable Tracy for the back-end of your site if you desire, which can be useful for module development.
Without labels:

With labels (split over 2 lines to fit here):

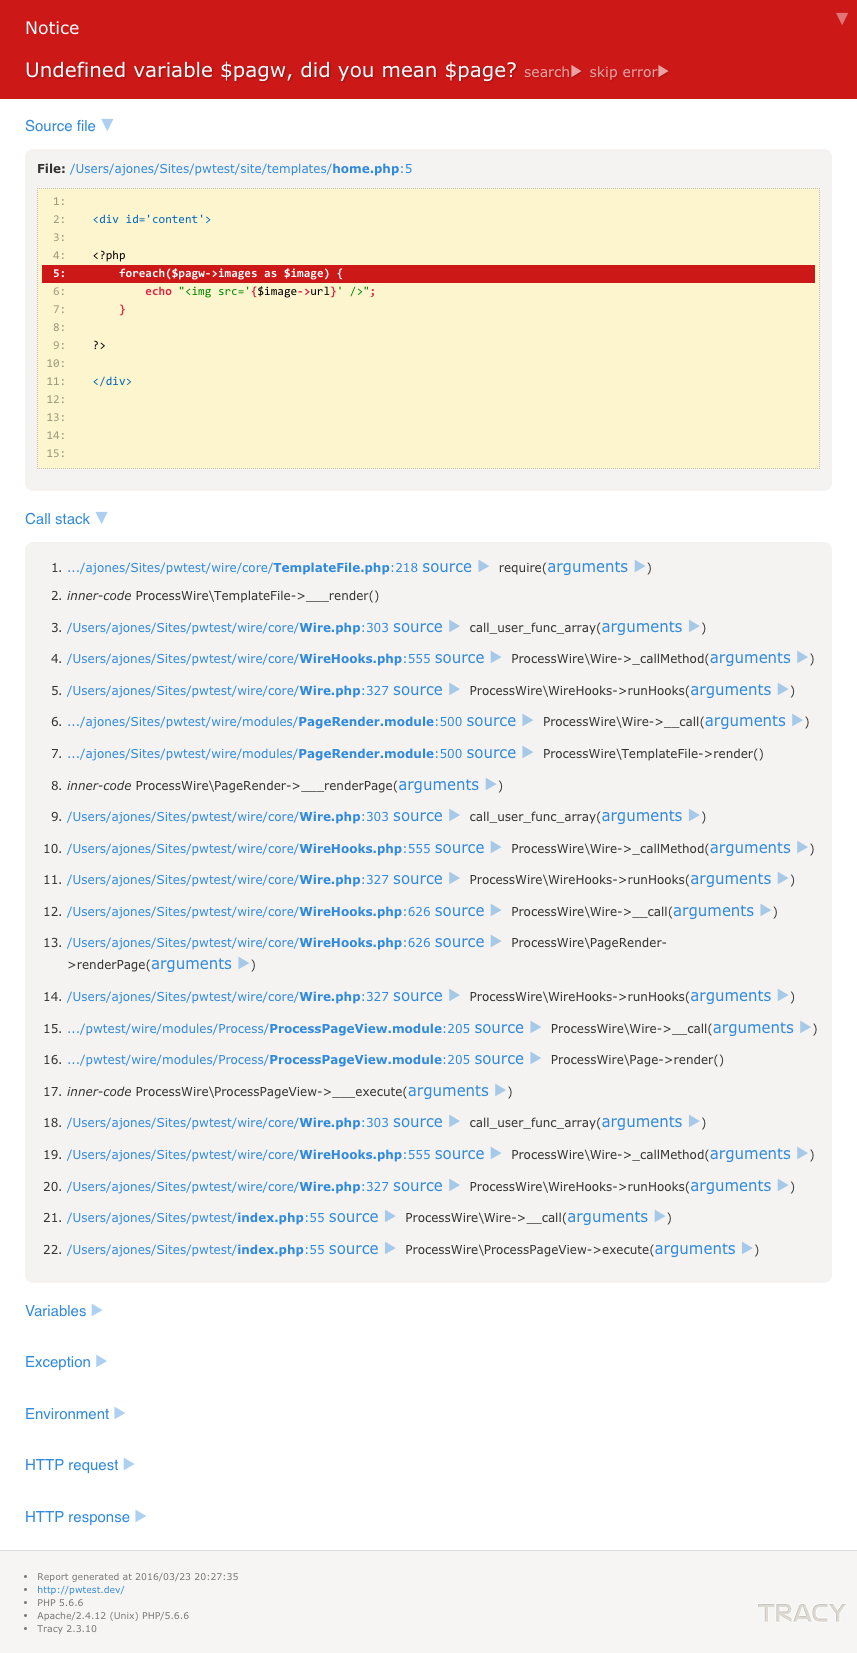
Any errors will be presented on the Tracy "bluescreen" which provides an expandable call stack of the error. You can easily navigate through this, expanding calls, and clicking to open files to the line of the error in your code editor.
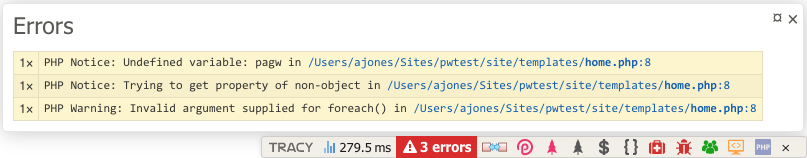
Notices and warnings are often overlooked or completely lost in a webpage, but with Tracy, they can be displayed either in the errors panel in the debug bar, or if you enable Strict Mode, then they will also be presented on the bluescreen.
If the example below, notice how I made a typo: $pagw instead of $page. Tracy automatically scans the list of available variables and makes a suggestion for the best match.
Hovering over the error lets you search the error in Google (not very useful in this example, but can be very handy with long obscure PHP errors), and in the case of notices/warnings, you can skip the error and load the page anyway.
Note the: File: /Users/ajones/Sites/pwtest/site/templates/home.php:5 link - if you click on that, it will open the file in your code editor and put your cursor on line #5.
In addition to the error and the line of code from the php file, it also presents a full call stack trace, as well as Variables, Exceptions, Environment, HTTP request, and HTTP response information - all potentially very useful in helping to debug the error.
Tracy provides four methods for dumping variables / messages for debugging purposes:
debugAll($var, $title) - outputs via all the dumping methods belowdump($var) - outputs to your pagebarDump($var, $title, $options) - ouputs to the debugger bar "dumps" panel, with optional titles for distinguishing multiple itemsfireLog($message) - outputs to the browser dev console (requires browser extensions for Chrome and Firefox)log($message) - outputs to a log file. By default, manually logged content is sent to: /site/assets/logs/tracy/info.log, but you can specify an optional second parameter to one of the following: 'debug', 'info', 'warning', 'error', 'exception', 'critical' files.There are a few other debug methods you can use in your php scripts:
addBreakpoint($name, $enforceParent) - named breakpoints for the Performance Paneltimer($name) - output via dump or barDump. To output, wrap in one of the dumping methods.templateVars(get_defined_vars()) - designed to work with PHP's get_defined_vars() to strip out PW variables. To output, wrap in one of the dumping methods.All these methods can be called via the "TD" (TracyDebugger) class, eg. TD::barDump(), or if you have no clashes, simply barDump(), or even bd(). Even though method shortcuts are not a great idea for regular code because of potential name conflicts and obscurity/maintainability, I am a big fan of them for debugging since they are only temporary and can save a lot of typing, so I use all the shortest versions:
da()d()bd()l()bp()t()fl()tv()If any of these functions/methods are defined elswhere in your site and you are getting a "previously declared" fatal error, you can disable them in the module's config settings.
da($var);debugAll is a shortcut for outputting via all the dump/log methods via the one call.
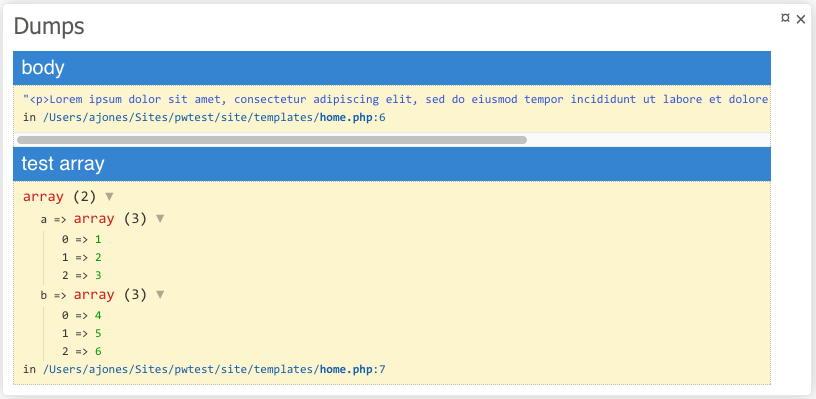
bd($page->body, 'body');
bd(array('a' => array(1,2,3), 'b' => array(4,5,6)), 'test array');
Note the second optional parameter used to name the outputs in the Dumps panel. Also see how the array is presented in an expandable tree - very handy when you have a very detailed/complex array or object.
You can also adjust the depth of array/objects, and the lengths of strings like this:
bd($myArr, 'My Array', array('maxDepth' => 7, 'maxLength' => 0));This can be very handy when you have a deep array or very long string that you need to see more of without changing the defaults of maxDepth:3 and MaxLength:150 which can cause problems with PW objects if you go too high. Setting to '0' means no limit so don't do this on maxDepth when dumping a PW object - it won't be pretty!
d($page->phone);With dump, the output appears within the context of the web page relative to where you made the dump call. Personally I prefer barDump in most situations.
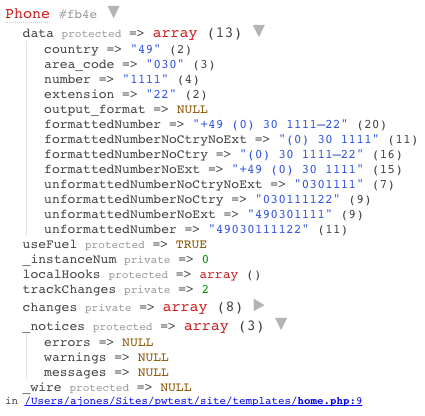
Tip: Don't forget PW's built-in getIterator() and getArray() methods when dumping objects - it can clean things up considerably by removing all the PW specific information. eg:
d($page->phone->getArray());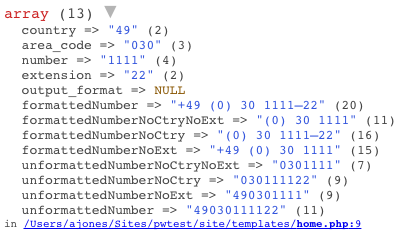
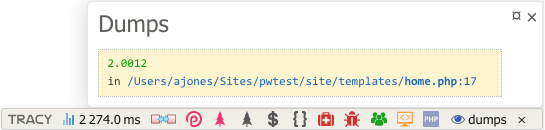
t();
// insert resource intensive code here
sleep(2);
bd(t());
You can also add an optional name parameter to each timer() call and then dump several at once in a single page load. Note the total execution time of the entire page in the debug bar - so we can assume the rest of the page took about 274 ms.
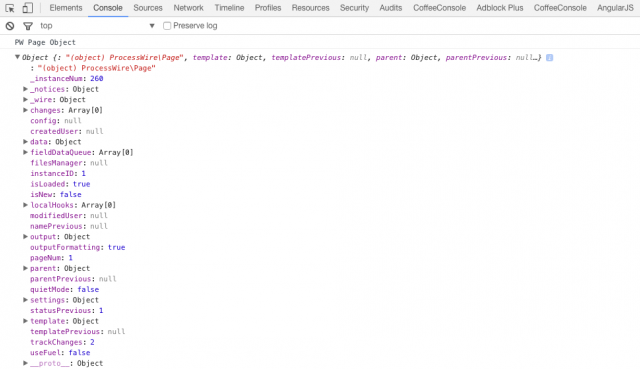
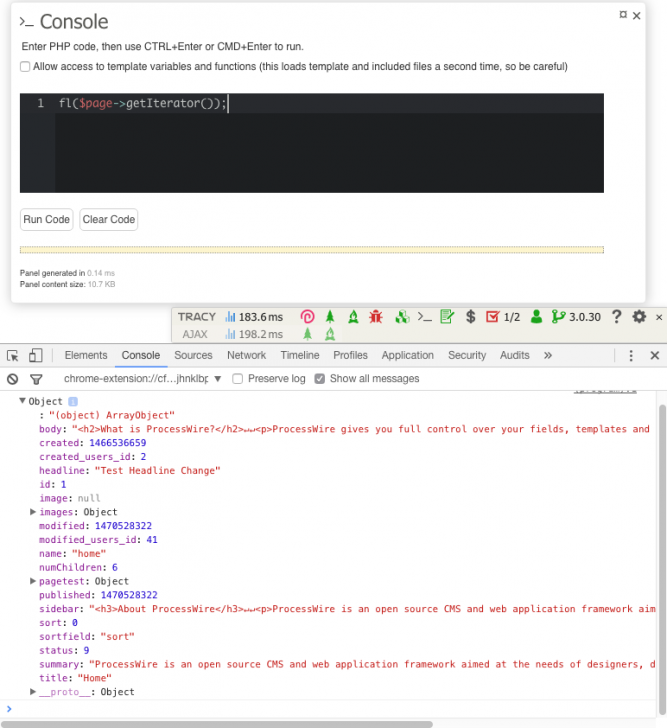
fl('PW Page Object');
fl($page);
This dumps to the developer console in Chrome or Firefox.
This is very useful when using PHP to generate a file for output where the other dump methods won't work. It can also be useful dumping variables during AJAX requests.
To make this work you must first install these browser extensions:
Chrome:
Firefox:
l('Message to debug.log file', 'debug');
l($page);
log() is useful if you want to store the results over multiple page requests.
Try this out in one of your template PHP files:
bd($pages->find("template=basic-page")->explode('name'));You will see something like this in your Dumps panel:
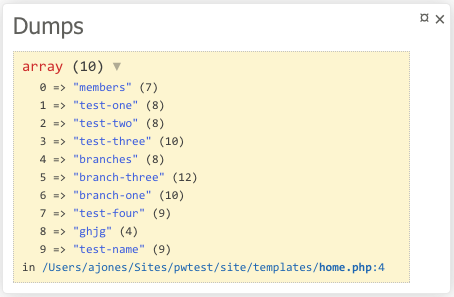
Here's an example output via barDump : bd()
$i=0;
$x=10;
bd(tv(get_defined_vars()), 'breakpoint one');
$i++;
$x--;
bd(tv(get_defined_vars()), 'breakpoint two');
This results in:
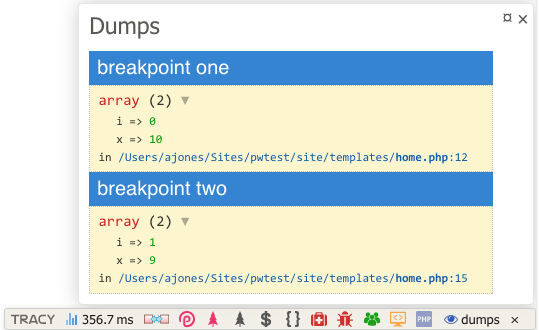
Without the tv() method wrapping the get_defined_vars() it would include all PW variables/objects and it would be difficult to see the variables you are interested in. Of course I could have just dumped $i and $x individually, but in situations where there are lots of variables involved, this is much quicker and easier.
This option reports all errors silenced by PHP's "shut-up(@)" operator. While it is generally not good practice to use the shutup operator, it can sometimes be useful, however, when debugging there are times when it is nice to see what errors this might be silencing.
If you find that you have a complex array or object, or a string is being truncated, you can adjust the maximum length of these settings. They are set quite low for performance issues, so if you do adjust these, it may pay to revert to the defaults when you are done.
TracyDebugger is initially configured in "Detect" mode which means it determines whether it should be in Development or Production Mode based on whether the site running on a public or local IP address.
In the config settings, you might also like to check the "Superuser Force Development Mode" option which means that superusers will always have Tracy in Development mode (even on live production sites) and therefore have access to the debug bar and error reporting.
In production mode Tracy can save any errors to its log files and email you whenever an error occurs. Just be sure to set up your email address in the config settings and make sure that "Allow Logging in Production Mode" is checked (default). Also check which error types you want logged in the "Log Severity" config setting.
After you receive an email, you need to visit the config settings to clear the "Email Sent Flag" so that you will start receiving additional email notifications. This is to prevent flooding of your inbox.
This might seem a little complicated at first, but hopefully with a little explanation it will be clearer :)
Even if it still seems a little confusing, don't worry - the default settings will keep live error reporting and the Tracy debug bar out of the hands of everyone on a live website.
If Tracy determines that the site is on a local IP address, then it will function in Development Mode and so everyone, including guests, have access to live error reporting and the debug bar.
If Tracy determines that the site is on a live server, then it will function in Production Mode and so all guests and users will NOT have access to live error reporting and the debug bar. The exception here is for superusers if you have checked the "Superuser Force Development Mode" option.
Tracy is forced into Production Mode and so all guests and users will NOT have access to live error reporting and the debug bar. Errors will be logged to file and emailed if you have that configured. Again, the exception is for superusers if you have checked the "Superuser Force Development Mode" option.
If this case you have forced into Development Mode even though you may be on a live server. In this case she behaves a little differently. By default, guests and non-superusers will function as though Tracy was in Production Mode. So if you want to debug something on a live server as a guest or non-superuser, then you need to give their role the "tracy-debugger" permission. This permission is not available automatically, so create it manually and add it to the required user's role. You can even do this with the guest role if you want. The way to make this safe on a live server is to use the "Restrict Non-superusers" option in the config settings. Here you can specify an IP address (exact or regex match) so that it is restricted to your computer.
The module has a variety of panels, most of which can be disabled / reordered via the module's config settings.
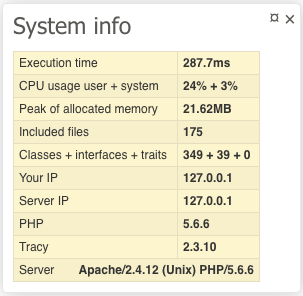
Provides a table of basic stats about the current page and your system.
This panel is only displayed when you have called the barDump() method and contains the contents of that dump. No need for an additional screenshot here - you have seen examples in the tutorial above.
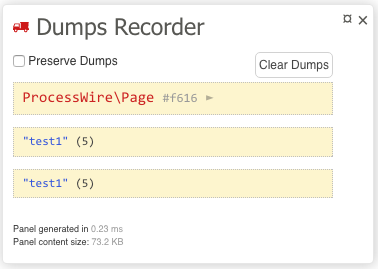
If this panel is enabled, any calls to bd() will be sent to this panel instead of the main dumps panel. This is useful in several situations where you want to compare various dumps, but is is invaluable when you have multiple ajax calls which are subsequently overwriting/removing the dumps panel from the AJAX bar. When the "Preserve Dumps" option is checked, dumps will be preserved until the session is closed. With it unchecked, they will be automatically cleared on page unload. This means it will store all consecutive ajax called dumps, and any dumps during php page redirects (which would be lost with the normal core Tracy dumps panel), but not burden the panel with lots of data unless you specify. The "Clear Dumps" button is there if you want to have a clear slate while testing ajax calls without needing to reload the page to clear.
The errors panel is only displayed when there are non-fatal errors and you are not in Strict Mode. All PHP notices and warnings will be displayed in this panel.
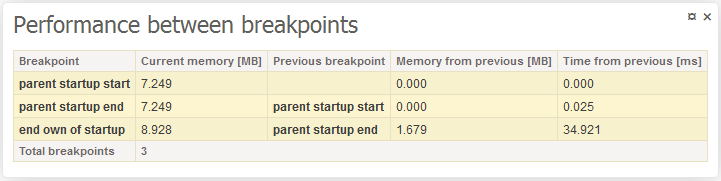
Performance Panel is a third party extension for Tracy developed by Martin Jirásek. It adds support for inserting named breakpoints in your code and reports execution time and various memory usages stats between the various breakpoints. This is where calls to addBreakpoint() are rendered.
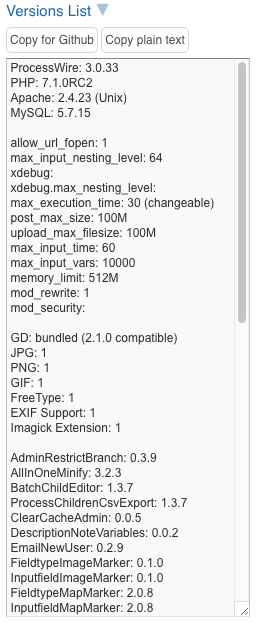
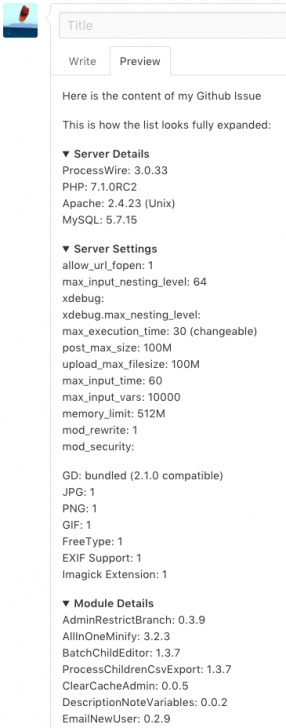
The Versions List section provides an easy to copy list of the versions of ProcessWire, PHP, MySQL, and Apache, along with all your third-party modules. This is very handy when creating Issue reports on the ProcessWire github issues repo: https://github.com/processwire/processwire-issues/issues
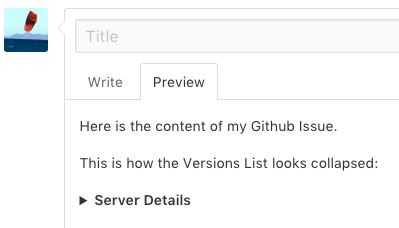
Please use the "Copy for Github" button to get an collapsed version to keep Issues cleaner. Use the "Copy plain text" option for pasting into a "Spolier" on the PW support forums.
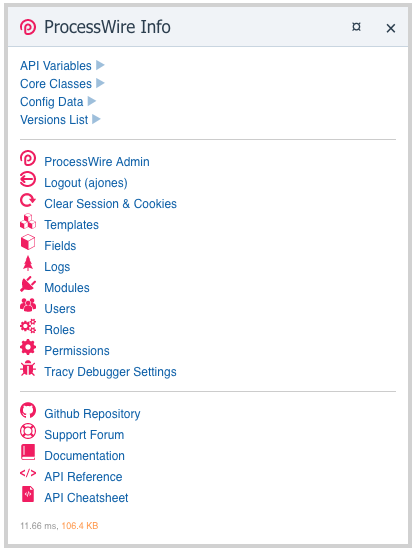
A variety of direct links to various parts of the PW admin panel. You can see these at the bottom of the Summary section screenshot above. Hover over the icons for tips on what they do.
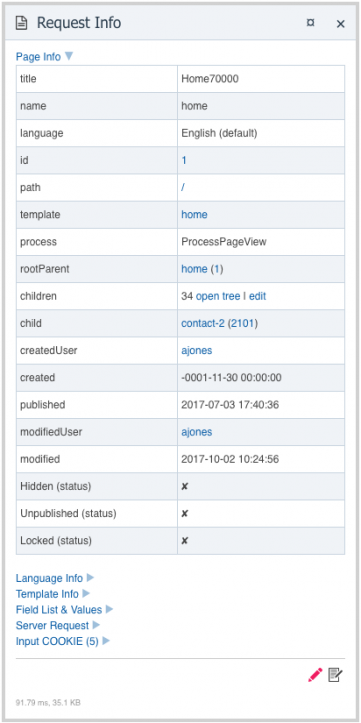
Provides very detailed infomation and links related to the current page. It contains several expandable sections listed below.
Links to view (from page name) and edit the page (from page ID), template, parent and sibling pages, etc. Also includes page status, creation, modified, and published username and datetime.
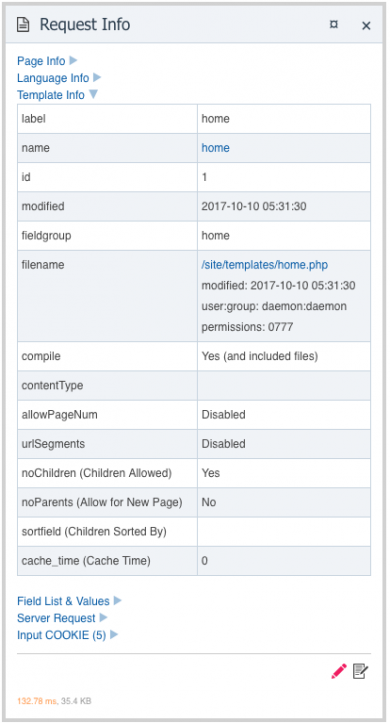
Details about the template of the current page and its settings, includes a link to open the template for editing in the PW admin, and the template file for editing in your code editor.
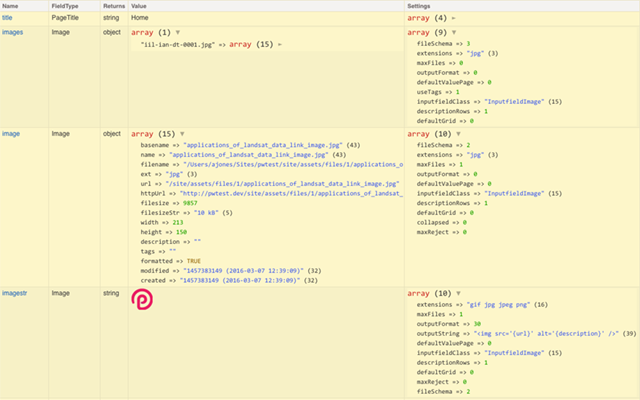
Complete list of all available fields for the page and their values - all arrays/objects are presented as expandable trees. For image fields it provides additional information, such as filesize and dimension attributes. There is also Settings column for each field - truncated in this screenshot so that everything else is legible.
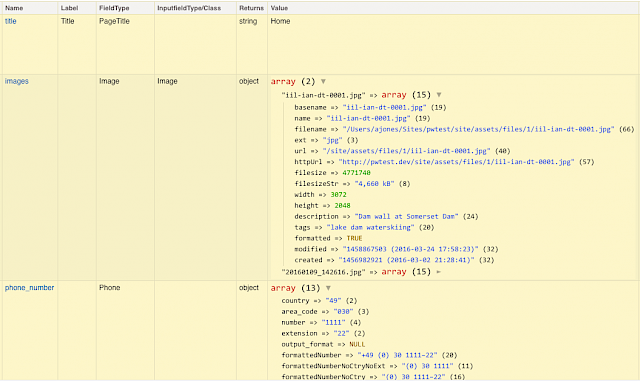
Here is another example showing three different image fields; images (with Maximum files allowed set to 0), image (with Maximum files allowed set to 1), and imagestr (with Formatted Value set to Rendered string of text). You can see the differences in what they return. The key thing is the multidimensional status of the array for the "images" field - you can see how you need to expand one of the images to see its various properties. But with the "image" field, it is a one dimensional array. This correlates to the need to call first(), last(), or eq() to get an image from the "images" field, but not for the "image" field. The"imagestr" field returns the exact output, which in this case is an img tag with the src specified (see the outputString property in the Settings column).
The full PW page object ($page) for the current page. It is presented as a collapsible tree. Not enabled by default because it can be slow - see config settings to enable.
The full PW template object for the current page. Not enabled by default because it can be slow - see config settings to enable.
The full PW fields object for the template of the current page. Not enabled by default because it can be slow - see config settings to enable.
Displays the most recent entries across all ProcessWire log files with links to view the log in the PW logs viewer, as well as direct links to view each entry in your code editor. By default it shows the last 10, but this can be changed in the config settings. A red icon indicates the last page load contained an errors or exceptions log entry. An orange icon is for all other log types.
Displays the most recent entries from the Tracy log files. These log files can be written to automatically when Tracy is in Production mode, or manually using TD::log() calls. Includes direct links to view each entry in your code editor. By default it shows the last 10, but this can be changed in the config settings. A red icon indicates the last page load contained an error, exception, or critical log entry. An orange icon is for all other log types.
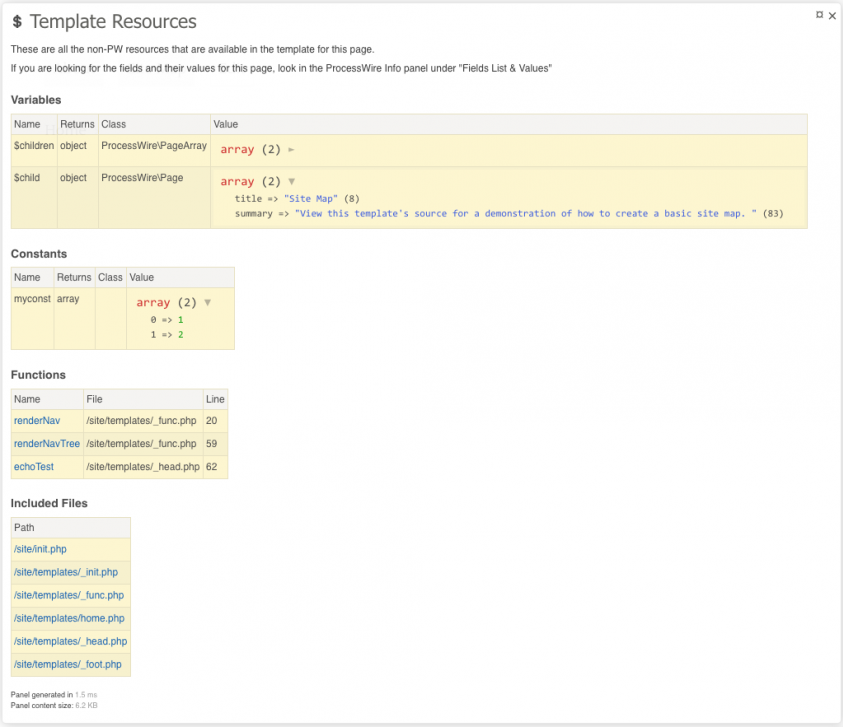
Displays the names, types, and values of all variables defined in the template file (and any other included files) for the current page. It also shows any defined constants and functions (linked to open in your code editor), as well as a list of included files (also linked to open in your code editor).
Lists all the available logging methods that you can call within your PHP code.
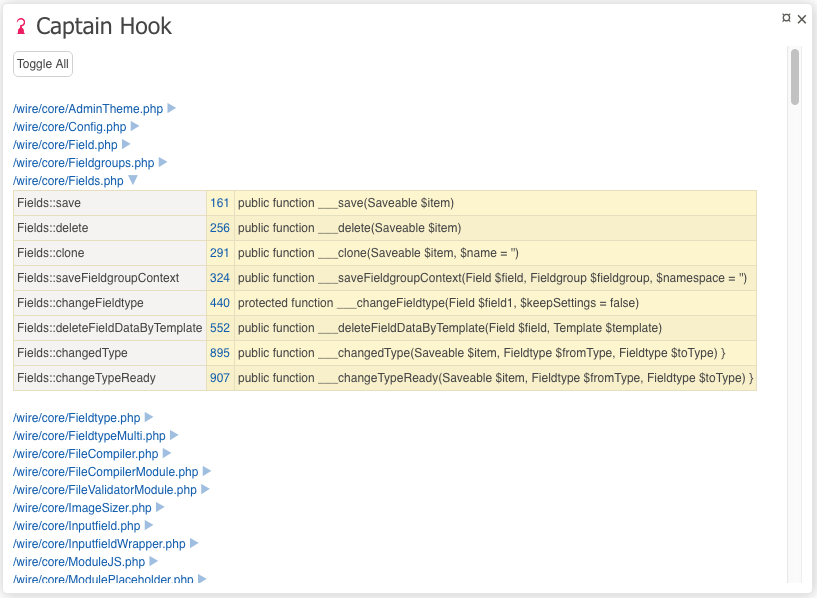
Generates a list of hookable methods from your ProcessWire install, including site modules.
If your editor protocol handler is setup, clicking on the line number will open to the method in your code editor. You can copy and paste the formatted hook directly from the first column.
Results are cached, but will be updated whenever you update your ProcessWire version or install a new module.
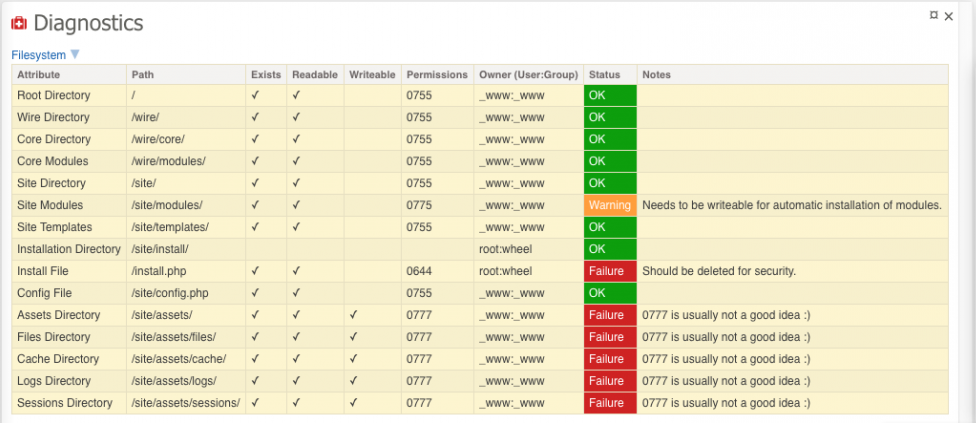
Overview of the filesystem access permissions for all the key folders and files in your PW install. It also provides status and notes about these. These should not be taken as definitive (especially if you are on a Windows system), but rather as a guide and reminder to check these. The debug bar icon for this panel is colored to match the most serious status level - OK, Warning, or Failure. This is particularly useful if you have the "Superuser Force Development Mode" option enabled because you will see the debug bar even in Production mode.
Some basic details about your MySQL server and client setup.
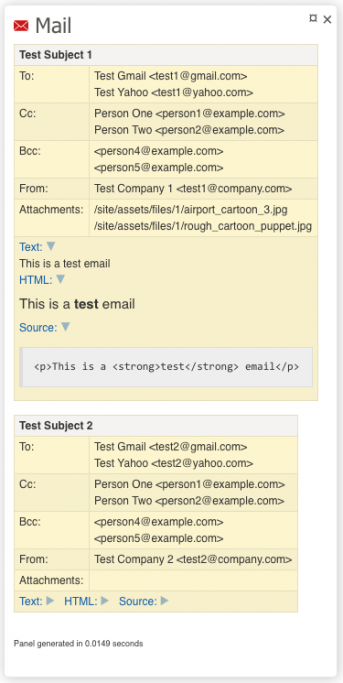
Intercepts all outgoing emails sent using wireMail() and displays them in the panel. Ideal for form submission testing. This panel is activated when enabled, so it's best to enable it from the Panel Selector using the sticky option when needed.
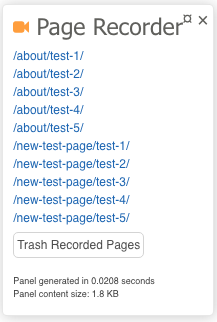
This panel records the ID of all pages added whenever it is enabled (so this is one you'll want off by default and just enabled via "Sticky" when you need it).
This is perfect for all sorts of testing, whether you need to create a LOT of pages for performance testing or you are testing a form which is automatically creating pages. Once you are done with the testing session, simply click the "Trash Recorded Pages" button and they will all be moved to the Trash.
This panel lets you define any Hook that you want to intercept. Much like the Mail panel, this new panel prevents the chosen hook from being executed, but instead, returns that contents of $event->object and $event->arguments in the panel instead. This may be useful for debugging all sorts of things but you MUST USE EXTREME CAUTION - for example, setting Pages::save and then deleting a page can result in some pages ending up having the trashed status, but their parent still listed as the home page. This is a situation that requires some careful database manipulation to fix.
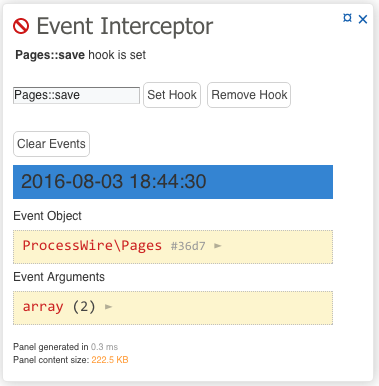
Green - no hook set
Orange - hook set, but nothing intercepted
Red - hook set and event intercepted
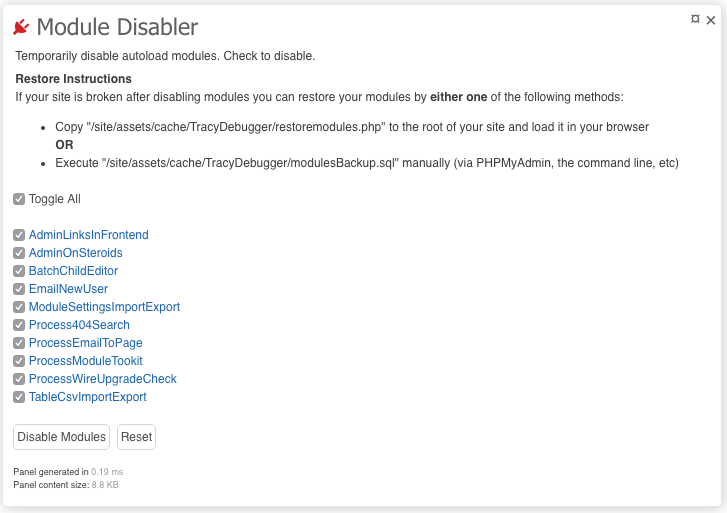
This panel makes use of the ProcessWire core "disabled" flag for disabling autoload modules for testing / debugging purposes. It can potentially result in a fatal error on your site (this is a ProcessWire core issue, rather than specific to this panel). Because of this, it is only available when ProcessWire's advanced and debug modes are enabled.
If you do end up with a fatal error after disabling a module, this panel provides a script for automatically restoring the modules database table. Whenever you disable any modules, a backup of the "modules" database table is automatically saved.
To restore you have two choices:
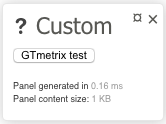
This panel lets you output anything you want. Primarily I see this being used for creating links to things like GTmetrix, but use your imagination.
The following code inserted in the module config settings,
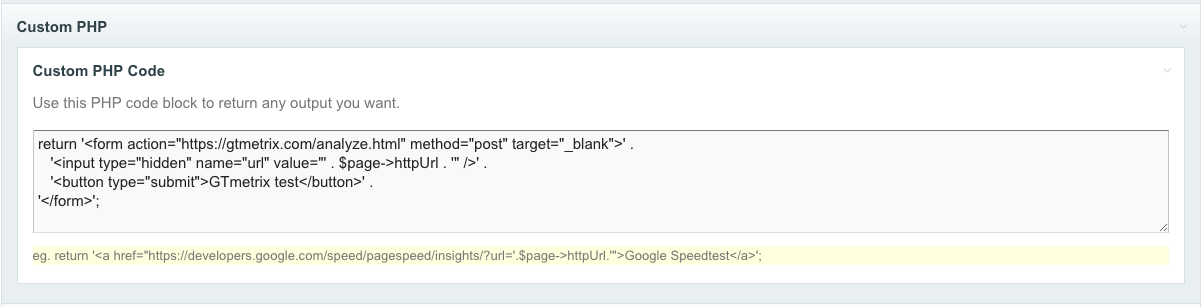
results in a link like this in the panel which will send the current page of your site to the GTmetrix test page.
Not really a panel, but this button on the debug bar lets you toggle Tracy on / off without needing to visit the module config settings. If you don't want another button always taking up room, you can also use the "Disable Tracy" button on the Panel Selector. Another alternative is the Hide/Show toggle icon at the far right of the debug bar. This doesn't actually turn Tracy off, but it get the debug out of the way.
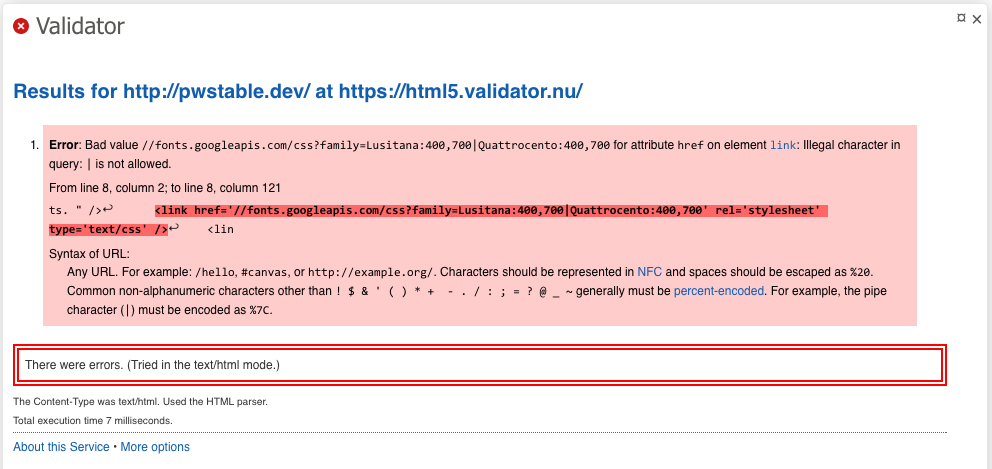
Validates the HTML of the page using the validator.nu service. This works with local development sites as well as live sites. The config settings also allow you to specify a username and password for sites protected by htaccess / htpasswd.
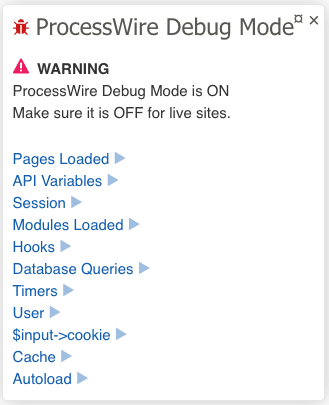
Provides access to all the information that is available in the back-end "Debug Mode Tools" section of your PW admin. This panel makes it available on the front-end and even when Debug Mode is off. Note that with Debug Mode Off, you won't have access to the "Database Queries", "Timers", and "Autload" sections. This is a ProcessWire core restriction.
The icon color on the debug bar is red when debug mode is on and green when it is off. This may seem opposite, but the idea is that when the icon is green, it is OK for production mode, whereas red indicates something that you need to be alerted to. This is particularly useful if you have the "Superuser Force Development Mode" option enabled because you will see the debug bar even in Production mode.
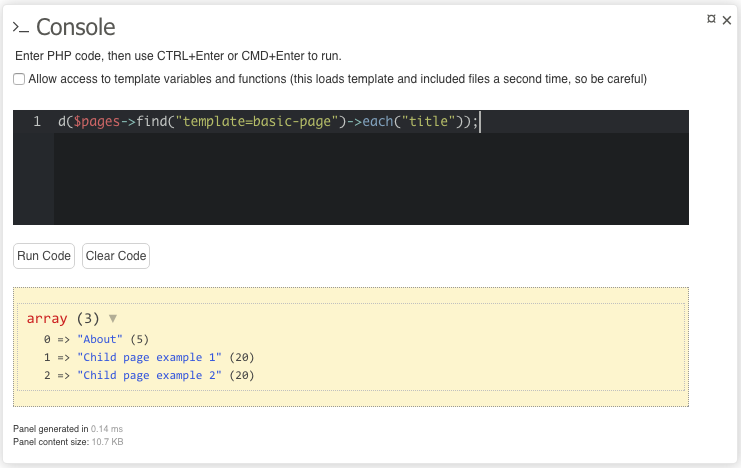
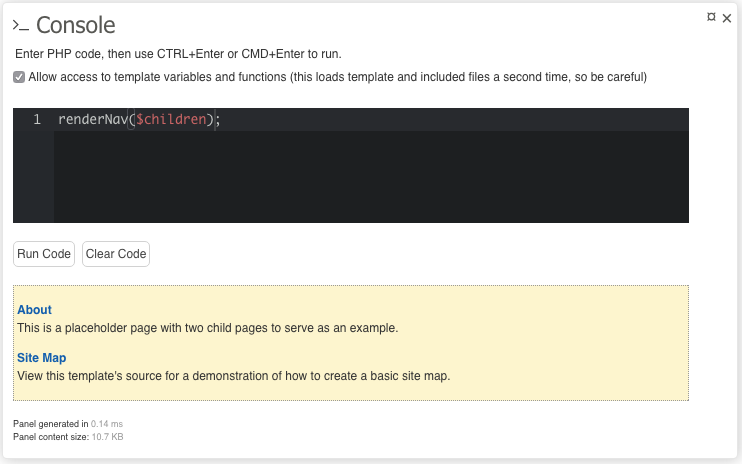
Here are the key points/features of this panel:
$pages, $page, $user, etcfl(), bd(), d(), and l() calls, or even simply echo()Remember that this allows you to run any PHP code, so be careful!
Here are some example calls and their results:
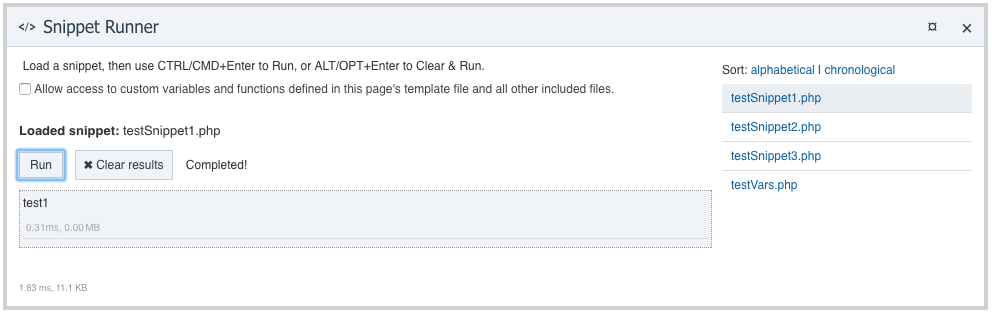
This is similar to the Console Panel, but instead lets you run snippets stored on the server's filesystem which allows for easier version control, and also for editing snippets in your code editor.
The template path panel allows you to temporarily choose an alternate template file for rendering the current page. It provides a list of files in the site/templates folder that match the name of the default template file, but with a "-suffix" extension. You can have several different versions and quickly test each one. You can make the change last for the browser session (sticky), or just for one reload (once). You can reset to the default template file for the current page, or all changes you may have made to other pages/template files on the site.
Not only is this useful for debugging (especially on a live production server), but it could also be used for sharing different versions of a page among trusted users.
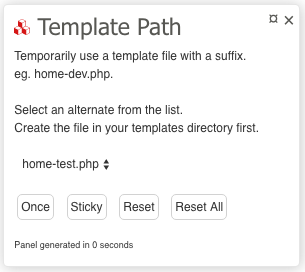
Red: The current page is using a different template file.
Orange: The current page is using it's default template file, but there are other pages on the site that are using a different template file (obviously via the Sticky option). Use "Reset All" to clear this when you're done testing.
Green: All pages on the site are using their default template files.
This is not reliant on the Template Path Panel, but its functionality is similar and its status is integrated into the panel, so it is presented here.
It makes it really easy to show authorized users development versions of template files. To make this work, all you need to do is enable the checkbox. Then setup a "template-****" permission and assign that to the required users.
Obviously this is not the best approach for major changes (you should set up a dev subdomain for that), but I think it could be quite handy for certain site changes.
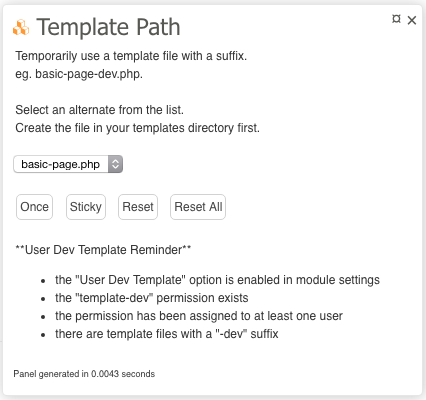
In this screenshot, you can see the reminder detailing why the icon is orange. Currently we are not viewing a page with an alternate template, but it is letting us know that:
So if this is expected then great, but if not, then you can prevent the alternate templates from being rendered by doing one or more of the following:
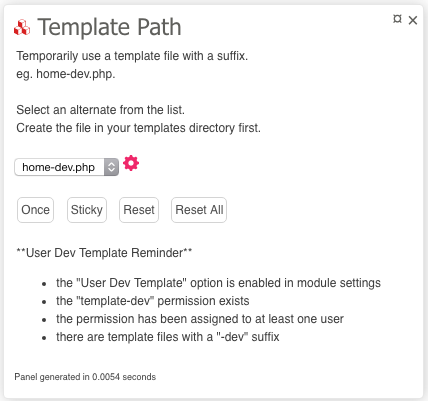
If you are on a page that is using an alternate template due to user permissions, then you will see the PW permission cog icon:
This is an alternative to the Template Path panel. It allows you to test changes without affecting other users currently viewing the site.
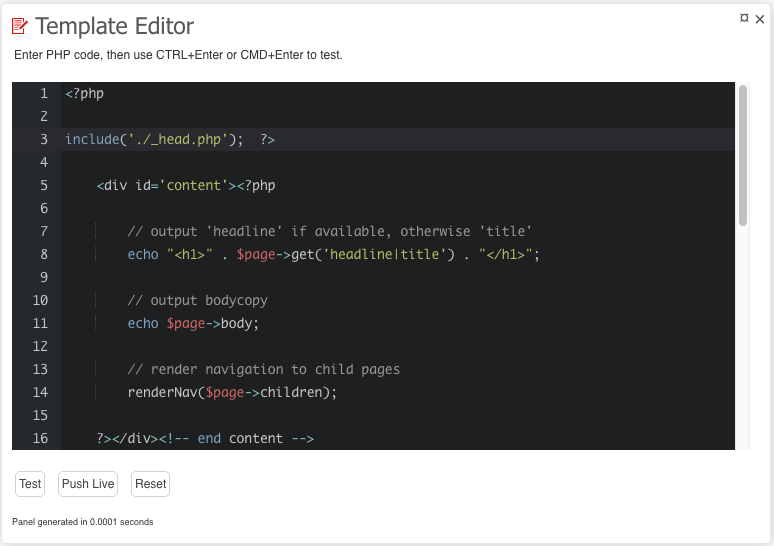
Red: Test code is being rendered.
Green: Saved template file is being rendered.
Note that there are three buttons:
Test: This will reload the page using the code in the editor - no changes are made to the template file or the code served to all other users of the site.
Push Live: This will save the editor code to the template file, making this a live and permanent change.
Reset: This will reload the page (and the code in the editor) with the code from the saved template file.
Possible use scenarios
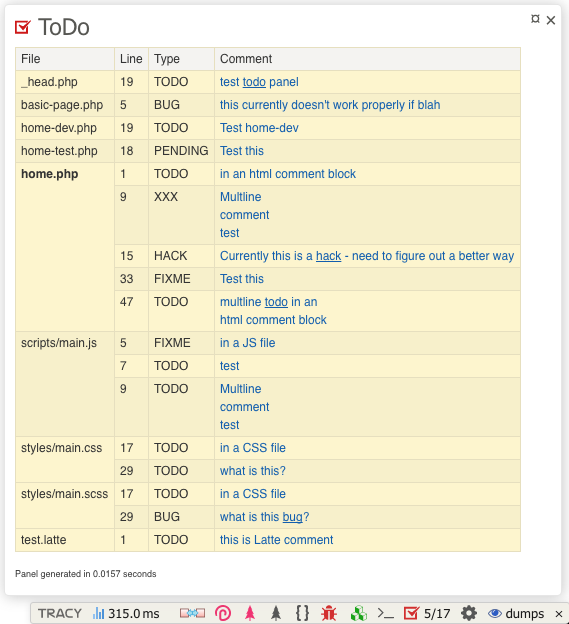
fl(), bd(), d() etc to your template file code without ever touching the actual template files.The ToDo Panel report the following comment types: 'todo', 'fixme', 'pending', 'xxx', 'hack', 'bug'. See the config settings for determining which folders and files will be scanned.
If you have your editor configured, the comment text link opens the file to the line of the comment.
The icon reports the number of items in the template file for the current file / the total number of items across all files.
Red: there are items for the current page's template file.
Orange: there are items in other files, but none in the current page's template file.
Green: no items in any files under /site/templates/
Lets you instantly switch your PW version. This is probably most useful for module developers, but can also be helpful for other users to help debug PW core or module problems. It's probably obvious, but the switcher is not recommended for live sites, so don't blame me if a version change breaks your site (especially between the 2.x and 3.x branch)!
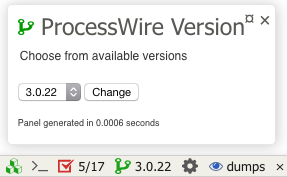
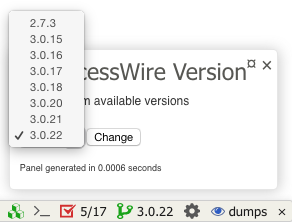
The available versions come from Ryan's ProcessWire Upgrades module - so any version that you installed via it will be available.
When you click "Change", it swaps the names of: wire/, .htaccess, and index.php - much easier than manually renaming.
The icon is green when you are using the latest version that is available on your system, and orange for any other version.
Allows you to instantly switch to any user in the system without knowing their password. After switching, you will still have full access to the Tracy debug bar, which can be very useful for debugging issues with other users and even guest (not logged in) visitors.
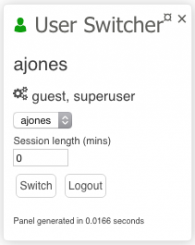
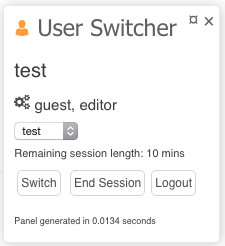
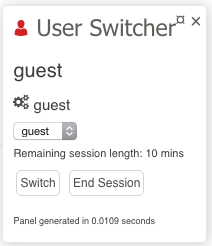
As usual, icon colors are meaningful, telling you what type of user is currently logged in:
Green: superuser
Orange: non-superuser
Red: guest / logged out
Lists all the users/roles with access to the Tracy Debugger bar. A green debug bar icon indicates that only superusers can access the debug bar. A red icon indicates that others have the tracy-debugger permission and may be able to see the debug bar. Another good reason to have the "Superuser Force Development Mode" option enabled because you will see this warning even in Production mode.
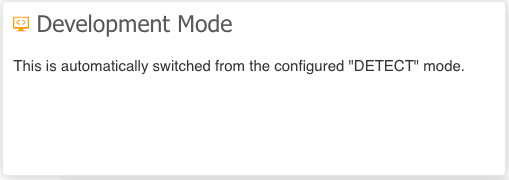
Indicates which mode Tracy is in - Development or Production - this is determined at runtime so if you have configured it to "Detect" mode, you can easily see which mode it has automatically switched to. This is useful if you have the "Superuser Force Development Mode" option enabled because you will see the debug bar even in Production mode.
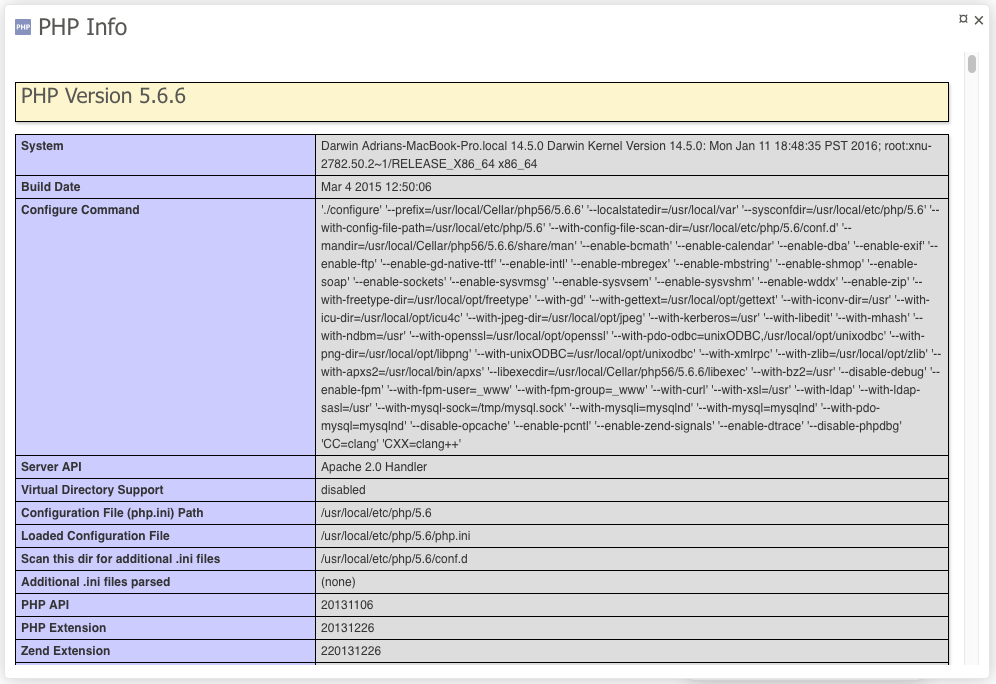
Provides all the output from PHP's phpinfo(). Probable best to leave disabled (default) unless you need to check something.
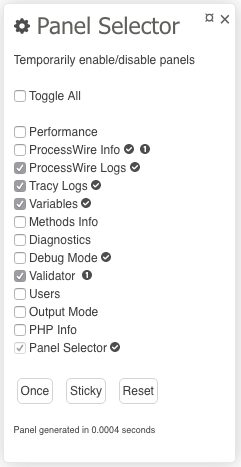
Allows you to set up a default set of panels in the module config settings and then easily enable / disable other panels from the debugger bar. There are three options: Once, Sticky, and Reset. "Once" will only make the selection change for one page load. "Sticky" will keep the changes for the browser session. "Reset" will return to the default set defined in the module config settings.
There are icons indicating if:
In the following example, you can see that:
All links from Tracy error messages and the custom ProcessWire Info Panel can be set up to open the file in your favorite code editor directly to the line of the error. By default the module is configured to work with SublimeText (my editor of choice), but it can be configured to work with pretty much any editor out there. Instructions for these are currently littered throughout the module's support thread, so do a search for your editor in there and if you can't find it, please feel free to add instructions yourself. So far, we have it confirmed as working in Sublime, Eclipse, PHPStorm, and UltraEdit.
In addition to configuring this module, you will most likely also need to register an appropriate protocol handler on your computer. If you happen to be on a Mac and use SublimeText, this one works perfectly, but a quick Google should find alternatives that suit your platform and code editor.
The Tracy website also has additional useful information about this.
In addition to the protocol handler setting, there is also a "Local Root Path" option which converts remote links to your local dev files.
Tracy is easily extendable allowing you to add custom panels to the debug bar and extensions to the "bluescreen". You can choose from a directory of third party plugins, or create your own. If you come across others that you think should be included, or you create one yourself that you'd like to contribute, please let me know.
There are a lot of settings for this module but hopefully the defaults will suit most users. I won't bore you with all the options here (I have already mentioned several throughout this blog post), but I would suggest that you take a thorough look as there are many possibilities that you might find useful. I would definitely recommend unchecking "Show Panel Labels" once you are familiar with things. I also like to use the "Superuser Force Development Mode" option. You'll also want to configure your email address for Production mode logging and the Editor Protocol Handler so that you have direct edit links to your script files.
Tracy itself seems to be in fairly continuous development with new features coming quite regularly. Just a few days ago, the master branch has just received support for displaying AJAX requests on the debugger bar, which is a pretty cool and useful new feature. Unfortunately the master branch of Tracy requires PHP 5.4.4. Since PW only requires PHP 5.3.8 I am keeping the TracyDebugger module on the 2.3 branch of Tracy for the moment.
EDIT: The latest version of TracyDebugger comes with both branches of Tracy and will use the master branch if you are running PHP 5.4.4.
Now that ProcessWire 3 supports installing of modules using Composer, I may look into it so that Tracy, PerformancePanel, and any future extensions can be updated automatically. But for now, I will continue to monitor these and update manually as required.
I mentioned this in the forum support thread but wanted to reiterate here how useful I think @horst’s ALIF module is. When used together with TracyDebugger you have some pretty powerful tools at your front-end fingertips.

ProcessWire 3.0.12 now supports the ability to use extended (UTF-8) page names, meaning your URLs can now have just about any characters that you want! More
This week we've got major upgrades to ProcessWire's selector engine, a great new version of Form Builder, and a few other core updates as well! More
Can
- 10 years ago
- 41
★★★★★Still only using on a local playground install but like it a lot..will definitely install on more PWs soon :D
Thanks for the nice work!
Reply
Adrian
Hi Can,
Thanks for the feedback - glad you are finding it useful. Be sure to let me know how it goes if you start using the Production mode logging and email notification feature.
Reply
Can
Sure :)
Reply
mr-fan
one word: awesome!
Reply
Adrian
Hi Sebastian,
I don't think you should ignore it, but I acknowledge that it isn't perfect. Perhaps it time it can be made to be smarter. I'd appreciate some more feedback on this. @matjazp even suggested that I shouldn't even show the permission, status and notes columns (https://processwire.com/talk/topic/12208-tracy-debugger/page-7#entry114399) for Windows users. I haven't taken that advice just yet, but maybe I should. Are you on Windows?
Perhaps the message is that you should take from it what you think is useful. It's still a great way to check that the install folder and file have been deleted, and that assets folders are writable. If you're not using the PW Upgrade module and you're manually installing modules, then you can check to see if the wire and site/modules folders are not writable.
Again, if anyone has any further suggestions on tweaking what is being reported in this panel, please drop me a line in the support thread.
Reply
Sebastian
Hi Adrian,
I'm not on windows, it's a https://box.scotch.io/ VM. Since that's a local dev box I'm not that concerned, will have a good look at the live page environment though. Going to have a look at the support thread now :)
Reply
Sebastian
- 10 years ago
- 21
★★★★★This looks like a really usefull extension - installed locally right away, thanks!
A question about the diagnostics panel, especially about file permissions:
Does "These should not be taken as definitive" more or less mean I could ignore it?
Because right now it tells me user and group are "vagrant" (I do run pw inside vagrant), but a quick ls -afl on the directories tells me user/group is [me] / staff.
Reply
Adrian
Well what are you waiting for ;)
Thanks for the pre-emptive thanks though!
Reply
adrian
A great write up
Reply
Adrian
Thanks Felix,
Sorry I missed your comment here. I have since posted this to Componette. Even though around here we all love ProcessWire, we also have a Latte module (http://modules.processwire.com/modules/template-latte-replace/) and some are using Nette Forms (https://processwire.com/talk/topic/2089-create-simple-forms-using-api/?do=findComment&comment=97399)
Reply
Jugibur
- 10 years ago
- 21
★★★★★I'm using your module since a while, but only scratching the surface. This gives me more infos to learn.
Thanks for your effort, Adrian!
Reply
Alan Bristow
- 10 years ago
- 21
★★★★★Hi Adrian, thank you SO much for this. I've not even installed it yet and I know I will be grateful ^_^ Cheers!
Reply
Alan Bristow
I'm chicken Adrian, got a slightly complex site coming to completion and frightened of doing something wrong and breaking it near a deadline (as if I'd ever do something wrong..). But srsly; looking forward to trying ^_^
Reply
Felix
Hi! Excellent work. We're trying to keep Tracy on top of debugging tools for PHP. By the way, Tracy is part of the Nette Framework, you should definitely take a look - https://nette.org. There is a great portal around Nette, it's called Componette - https://componette.com.
We're here for you, please let contact us anytime.
Felix / Nette
Reply