1 July 2022 by Ryan Cramer
ProcessWire's core comes with a lot of helpful debugging tools and capabilities built-in. In this post we'll cover some of these useful tools and how to use them.
Beyond the core there also a few useful modules for debugging, in particular Tracy Debugger. There's also Profiler Pro which is a tool for profiling code. I'm quite fond of both of these tools. If you are a serious debugger then chances are you are already using Tracy and potentially Profiler, and I can certainly recommend them both. But this article instead focuses just on the tools that come with the core — those that are already built-in and ready to use. These are good to know about whether using additional 3rd party debugging tools or not. So let's dive in...
ProcessWire’s debug mode
ProcessWire has a debug mode which is what you usually want enabled during site development or when troubleshooting. Debug mode is set in your /site/config.php file like this:
$config->debug = true; // or false
When debug mode is TRUE:
- The site is in a state suitable for development or troubleshooting.
- PHP errors, warnings and notifications are not suppressed.
- Fatal errors are output directly (in red).
- Each request uses more resources (especially memory).
- Requests may render a bit slower than without debug mode.
- ProcessWire maintains various runtime timers, especially during boot.
- ProcessWire logs database queries in memory.
- ProcessWire logs what pages were loaded in the request, in memory.
- ProcessWire logs class loader activity in memory.
When debug mode is FALSE:
- The site is in a state suitable for live/production usage.
- PHP errors, warnings and notifications are completely suppressed for security.
- Fatal errors are rendered as anonymous "500 server error".
- Fatal errors also display the /site/templates/errors/500.html file (if present).
- While fatal errors aren't shown, they are still logged to files (Setup > Logs).
- In-memory logging is disabled for reduced memory usage.
- Requests may render faster than in debug mode.
I recommend that you always have debug mode enabled during site development, such as in your local development environment. Likewise, you should never have debug mode enabled for a live site, as things like fatal errors shouldn't be visible to site visitors for security reasons.
Using debug timers
Timing how long something takes is an important part of debugging and profiling and can be immensely helpful in tracking down bottlenecks and identifying ways to improve the performance of your code. ProcessWire comes with a really simple tool to time how long something takes: the Debug::timer() functions. Here's how you use them:
$timer = Debug::startTimer();
// ...
// some code you want to time
// ...
$elapsed = Debug::stopTimer($timer);
The $elapsed variable will contain a floating point number string with the number of seconds that were elapsed since you started the timer. So you might output it like this:
echo "$elapsed seconds"; // i.e. "1.001 seconds"
When you stop a timer, that timer also stops recording. If you want the timer to continue recording (like if you want to get multiple elapsed times from the original timer) then use Debug::timer() to get the current elapsed time without stopping it:
$timer = Debug::startTimer();
// ...
// some code you want to time
// ...
$elapsed1 = Debug::timer($timer);
// ...
// some more code
// ...
$elapsed2 = Debug::timer($timer);
// etc.
Named timers
When you call Debug::startTimer() it comes up with a unique name for the timer automatically and returns it (see the $timer variable above). This enables you to use it later when you want to stop that timer or get the elapsed time. But you are also welcome to choose your own name for the timer. This is useful especially in cases where you start and stop your timer in different places where your $timer variable (or whatever you name it) is no longer in scope.
Debug::startTimer('my-timer-name');
// ....
$elapsed = Debug::stopTimer('my-timer-name');
What if you want milliseconds rather than seconds?
When you stop the timer, tell it you want milliseconds (ms) rather than seconds, like this:
$elapsed = Debug::stopTimer($timer, 'ms'); // i.e. 1001ms
When you ask for milliseconds it also automatically appends the suffix "ms" to the returned value.
Perhaps you want milliseconds for all of your timers? In that case, you can tell it to use it for all future timers like this:
Debug::timerSetting('useMS', true);
Saving timers to output later
In all of our examples above, we're assuming that you have something to do with the timer value after you've retrieved the elapsed time or stopped the timer. Perhaps that is not the case, and you want to simply retrieve all of your saved timers later to output somewhere, such as the footer of a document. To do this, use Debug::saveTimer() rather than Debug::stopTimer(), like this:
Debug::startTimer('my-saved-timer');
// ...
// some code you want to time
// ...
Debug::saveTimer('my-saved-timer');
You can also provide additional notes to save with the timer:
Debug::saveTimer('my-saved-timer', 'Some notes about this timer');
Note that when you call saveTimer() it also stops the timer. When you want to later retrieve the saved timer, you can do this:
$value = getSavedTimer('my-saved-timer');
The returned value will be the time in seconds or milliseconds. If you specified notes with your saveTimer() then those will be appended to the timer string like this "0.123 - Some notes about this timer".
You can also get all saved timers at once by using the Debug::getSavedTimers() function. This returns an array of all saved timers, indexed by timer name:
foreach(Debug::getSavedTimers() as $name => $value) {
  echo "<li>$name: $value</li>";
}
Note: If you do the above and ProcessWire's debug mode is enabled, you'll notice ProcessWire is already using this for some of its own "boot" timers. If you need to skip over them you can do this:
foreach(Debug::getSavedTimers() as $name => $value) {
  if(strpos($name, 'boot') === 0 || strpos($name, 'init') === 0) continue;
  echo "<li>$name: $value</li>";
}
How ProcessWire uses saved timers
When ProcessWire is in debug mode, you have a "Debug" panel that appears in the admin. When opened, theres a "timers" section and that's where ProcessWire displays all the saved timers. If you happen to save any of your own timers during an admin request, you'll see them appear there as well.
Need more advanced timing capabilities? Be sure to check out ProfilerPro.
Database query logging
When debug mode is enabled ProcessWire keeps a log of all database queries. If you want to retrieve that log, here's how you can do it:
$queries = $database->queryLog();
The returned $queries is an array of strings each containing a database query string. If you want to start query logging from a particular starting point (clearing any previously logged queries) you can do this:
$database->queryLog(true);
Or to stop logging queries at any point…
$database->queryLog(false);
The query log is simply an array of SQL strings. To output the log of queries you might do something like this:
foreach($database->queryLog() as $n => $sql) {
  $sql = $sanitizer->entities($sql);
  echo "<li>$n. $sql</li>";
}
Debugging markup regions
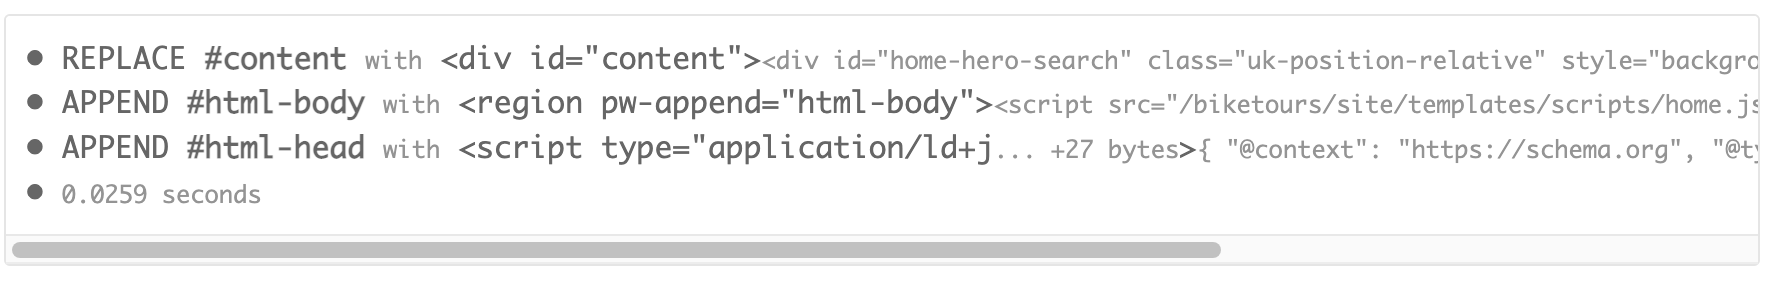
If you are using markup regions as your front-end output method, ProcessWire includes a handy debugging tool that enables you to display what regions it populated, how many bytes were used, and how long it took. It also reports any errors of regions it wasn't able to populate. It is really helpful in tracking down bugs! To enable it, simply insert the HTML comment <!--PW-REGION-DEBUG--> where you want it to output in your markup. It will be replaced with a <pre> element that might look something like this:
 I usually output it conditionally in the footer of every page so that it only appears to me when I'm logged in, and only if I have debug mode enabled. I also like to wrap it in a
 <div> of my own in case I want to reveal it with a button or apply some unique styling to it:
<?php if($user->name === 'ryan' && $config->debug): ?>
  <div id="region-debug" class="uk-container uk-margin">
    <!--PW-REGION-DEBUG-->
  </div>
<?php endif; ?>
Debugging in the admin
When debug mode is enabled, you'll see a "Debug" or "Debug mode tools" link in the admin that appears on your user/profile menu, as well as in the footer of the admin interface. When you click it, it reveals a panel of various details about the request such as:
- What pages were loaded including their id, path, and class name.
- What API variables are available.
- What session values are present.
- What modules were loaded in the request, and how many were NOT loaded.
- What hooks are present in the request, and what the callers were.
- What timers were recorded and their elapsed times.
- What we know about the current user, roles, permissions.
- What GET, POST and COOKIE variables were present in the request.
- What caches were used in the request.
- What PHP classes were auto-loaded by PW’s class loader.
- What resources were lazy loaded (if $config->useLazyLoad is enabled).
Any of these can be enabled or disabled by using the $config->debugTools configuration setting (see /wire/config.php for details). All of the above are enabled by default except for the 'lazyload' (last) option.
Debugging page paths and URLs
If you ever wonder why a particular URL/path resolves to a particular page, URL segments, language, pagination, etc., ProcessWire has a really helpful class for identifying all the details of it: the $pages->getInfoByPath() method. It can be used like this:
$info = $pages->getInfoByPath('/some/path/here/');
It returns an associative array with everything known about the path and how it mapped (or didn't) to a page. For instance, let's take the following example:
$info = $pages->getInfoByPath('/en/foo/bar/page3');
Here's an example of the returned array for that call above:
[
  'request' => '/en/foo/bar/page3',
  'response' => 200, // one of 200, 301, 302, 404, 414
  'type' => 'ok', // response type name
  'errors' => [], // array of error messages indexed by error name
  'redirect' => '/redirect/path/', // suggested path to redirect to or blank
  'page' => [
    'id' => 123, // ID of the page that was found
    'parent_id' => 456,
    'templates_id' => 12,
    'status' => 1,
   'name' => 'foo',
  ],
  'language' => [
    'name' => 'default', // name of language detected
    'segment' => 'en', // segment prefix in path (if any)
    'status' => 1, // language status where 1 is on, 0 is off
  ],
  'parts' => [ // all the parts of the path identified
    [
      'type' => 'language',
      'value' => 'en',
      'language' => 'default'
    ],
    [
      'type' => 'pageName',
      'value' => 'foo',
      'language' => 'default'
    ],
    [
      'type' => 'urlSegment',
      'value' => 'bar',
      'language' => ''
    ],
    [
      'type' => 'pageNum',
      'value' => 'page3',
      'language' => 'default'
    ],
  ],
  'urlSegments' => [ // URL segments identified in order
    'bar',
  ],
  'urlSegmentStr' => 'bar', // URL segment string
  'pageNum' => 3, // requested pagination number
  'pageNumPrefix' => 'page', // prefix used in pagination number
  'scheme' => 'https', // blank if no scheme required, https or http if one of those is required
  'method' => 'pagesRow', // method(s) that were used to find the page
]
Using ProcessWire backtrace
A backtrace provides details on what happened to reach the current state. This can be really handy when you are trying to debug some issue or another as it gives you a map of how it reached a particular point, such as an error.
ProcessWire includes its own backtrace method named Debug::backtrace(). It can be a lot nicer to use than PHP's debug_backtrace() function. ProcessWire's backtrace method is also aware of several things that PHP's isn't, such as hooks; and it knows of irrelevant things to automatically exclude. In fact, you may sometimes find PHP's debug_backtrace() method to be painful or not-so-useful in ProcessWire since it is often full of illegible hook calls rather than the code you are trying to track. Using Debug::backtrace() can provide a more useful experience in ProcessWire.
The Debug::backtrace() method returns a PHP array of calls that led to the current point. For a really simple test case, let's try adding it to our /site/templates/admin.php and then viewing a page in the admin:
$wire->message(Debug::backtrace());
Here's the result below, which shows us the calls in order of newest to oldest. The file property gives us the filename that was loaded, and the line number. The call property shows us the method or function call that was used.
[
  {
    "file": "/wire/core/TemplateFile.php:327",
    "call": "require('/htdocs/site/templates/admin.php')"
  },
  {
    "file": "/wire/modules/PageRender.module:575",
    "call": "TemplateFile->render()"
  },
  {
    "file": "/wire/modules/Process/ProcessPageView.module:184",
    "call": "$page->render()"
  },
  {
    "file": "/wire/modules/Process/ProcessPageView.module:114",
    "call": "ProcessPageView $process->renderPage(Page $obj, PagesRequest $obj)"
  },
  {
    "file": "/index.php:55",
    "call": "ProcessPageView $process->execute([ true ])"
  }
]
You can also get the backtrace as a string by using the getString option:
$wire->message(Debug::backtrace([ 'getString' => true ]));
And here's the result from that:
0. /wire/core/TemplateFile.php:327 » require("/htdocs/site/templates/admin.php")
1. /wire/modules/PageRender.module:575 » TemplateFile->render()
2. /wire/modules/Process/ProcessPageView.module:184 » $page->render()
3. /wire/modules/Process/ProcessPageView.module:114 » ProcessPageView $process->renderPage(Page $obj, PagesRequest $obj)
4. /index.php:55 » ProcessPageView $process->execute([ true ])
As you can see, the getString option provides a more condensed output that may be preferable in some cases (and not in others).
Debugging PageArray values
Many ProcessWire page finding methods return PageArray values (an array of pages). This includes methods like $pages->find(), $page->children(), etc. A little known feature of PageArray values is that they keep track of how their pages were found. More specifically, they keep track of what Selectors were passed to the $pages->find('selectors') that found them. You can retrieve that information by using the getSelectors() method:
$items = $pages->find("template=blog-post, sort=-date, title*=markup");
// ...
$s = $items->getSelectors(); // returns Selectors object
$s = $items->getSelectors(true); // returns selector string

echo $s; // output: template=blog-post, sort=-date, title*=markup
This can be handy if you are working with a PageArray and want to know where it came from. But it can also be handy if you want to create a variation or filter of that PageArray. You can do that by taking the resulting selector, adding to it, and then performing another $pages->find() from it.
Logging tools for debugging
One of the biggest considerations in debugging is in how to communicate that runtime debugging information to the developer. The quick and dirty way is to do an echo "gotcha!"; or die("gotcha!"); or throw new WireException('gotcha!'); but this is rarely the best way to communicate something, unless it's literally a fatal error you want to communicate. If using a tool like TracyDebugger you've got functions like bd('gotcha!'); that are useful for communicating runtime messages to yourself, the developer. But ProcessWire also comes with a $log API variable that can be useful not just for ongoing logging, but also for runtime debugging. Here's how you use it:
$log->message('Logs to /site/assets/logs/messages.txt');
$log->warning('Logs to /site/assets/logs/warnings.txt');
$log->error('Logs to /site/assets/logs/errors.txt');
Better yet, perhaps you want to maintain your own log independently of the standard message/warning/error logs:
$log->save('my-log-name', 'Logs to /site/assets/logs/my-log-name.txt');
Note: if $log is out of scope, you can also use wire()->log or log().
How is this useful during debugging? Well, if you keep one window open to Setup > Logs > log-name, the screen automatically updates with any new log entries at the top. So you can log something in one window and see it appear in the other window.
This is a convenient way to communicate debugging related messages to yourself during development. Granted, it's not quite as handy as a Tracy bd() (and related) calls, but still pretty handy and useful for something that is already built-in, and always present.
When using the $log API variable, all the methods log to text files. Meaning you could also monitor them for live updates from the unix command line via:
tail -f /path/to/site/assets/logs/my-log-name.txt
One thing to be aware of is that logs stick around until they are deleted or pruned. So if you don't want your runtime debugging messages taking up space on the file system, delete the log file when you are done.
Runtime notifications for debugging
All classes in ProcessWire have message(), warning() and error() methods. These can be called on any Wire derived variable in ProcessWire, including all the API variables:
$wire->message("Message text");
$wire->warning("Warning text");
$wire->error("Error text");
These record notifications for later output in the same request. Unlike $log, these don't get saved to text files and instead are assumed to be temporary and displayed in the current (or next) request.
If you are in the ProcessWire admin environment, then you'll already be familiar with these as they are displayed at the top of the screen as message, warning or error notifications. This can be useful for notifications or debugging if you are doing something in the admin. But you can still use them on the front-end too, so long as you render them somewhere.
How might you render your own notifications? They are stored in the $notices API variable and all you have to do is iterate them. In the example below, I'm translating ProcessWire notices to Uikit "uk-alert" notifications on the front-end:
$classes = [
  'messages' => 'uk-alert-success',
  'warnings' => 'uk-alert-warning',
  'errors' => 'uk-alert-danger',
];

foreach($notices as $notice) {
  $text = $sanitizer->entities($notice->text);
  $name = $notice->getName(); // notice type name: messages, warnings or errors
  $class = $classes[$name];
  echo "<p class='$class' uk-alert>$text</p>";
}
Advanced mode
We've already talked about Debug mode, but there's also an Advanced mode which takes debug mode even further. Though I would say that Advanced mode is more useful for core and module developers than for regular site development. It is enabled by setting $config->advanced = true; in your /site/config.php file.
Be careful with this as some options configured in advanced mode (like system statuses) cannot be removed once set (at least not without going directly into the database). Below is a summary of what enabling advanced mode adds and/or changes:
Fields (Setup > Fields):
- Enables "system" and "permanent" flags as checkboxes on the Advanced tab when editing a field.
- Makes the admin Setup > Fields dropdown show all fields, including system fields.
- Enables creation of new fields using types only allowed in advanced mode.
- Enables cloning of system fields.
- Enables showing of System templates when selecting templates to add field to (Actions tab).
Templates (Setup > Templates):
- Makes the admin Setup > Templates dropdown show all templates, including system templates.
- On the Basics tab, enables you to select a Fieldgroup independent of the Template.
- Enables you to add "Permanent" flagged fields to a template.
- When editing a template, makes it show a "System" tab with ability to assign system flag, predefined page class name, cancel of global status, setting to make the "name" field appear in the Content tab of the page editor, option to make page deletions bypass the trash, and option to disable the Settings tab in the page editor.
- Enables you to copy fields from another Fieldgroup maintained by a system template.
- Makes the "Advanced" tab show API examples with the Inputfield notes.
Page Editor:
- Enables showing of "Object type" Page class name on Settings tab Info fields.
- Enables you to select System or SystemID status for a Page on the Settings tab Status field.
- Enables some template changes for superuser that go beyond configured Family settings.
Other:
- In Modules, enables disable of autoload state for existing autoload module, for debug purposes.
- In Lister, paired with debug mode, shows a fully parsed selector under the Lister table.
- Shows an "Advanced mode" label in the footer of the admin theme.
If you don't specifically need to do one of those things above, or don't know what those things above even are, then it's best to keep advanced mode disabled. But it's good to know that it's there, when or if you ever find you need it for some reason or another.
Thanks for reading and if you are interested in this topic be sure to check out Tracy Debugger too, if you haven't already.
Comments
 I usually output it conditionally in the footer of every page so that it only appears to me when I'm logged in, and only if I have debug mode enabled. I also like to wrap it in a
Adrian
Awesome summary Ryan!
Just one thing I wanted to mention regarding Tracy communicating runtime messages. Note that the "Enable Guest Dumps" option on the Panel Selector allows logging guest user calls to bd() to the Bar Dump panel.
Reply
HMCB
- 4 years ago
- 31
★★★★★Pretty awesome. I especially liked the PageArray tools. Thank you for this write-up.
Reply
MrSnoozles
- 4 years ago
- 22
★★★★★Incredible post. Will come back to this later for sure. It probably would make sense to to link it in the documentation
Reply