PrevProcessWire 3.0.40 core and more
New master and dev versions released, more coverage of what you can do with the new Functions API, plus a couple useful tips and tricks. More
Regardless of how unpredictable the world is, or whatever direction it moves in, ProcessWire is and will always be stable and predictable, always getting better, moving forward, never backward. You can count on that. While we don't have a new core version for you this week, 3.0.41 will be here next week, with 3.0.40 becoming the new master at the same time. This week, I'll introduce something new I've been working on for awhile here, and think some of you might find it as useful as I have.
Like all the Pro modules, the ProDevTools set of modules are tools that bring major benefits to the projects you work on. But unlike the other Pro modules, the ProDevTools set of modules are primarily for you, the web developer, while the results are for the clients. The emphasis is on supporting the development and optimization process of websites, enabling you to deliver a better, faster and stronger product.
The first release of ProDevTools will include two modules: ProfilerPro and ProDocs. We'll also be adding more modules to this set as time goes on, like we've done with ProFields. This week we'll take a look at the first in the set, ProfilerPro…
Website performance is such an important aspect of web development. The performance of a site can literally make or break the effectiveness of it. When users wait, they leave. When Google sees slow performance, it penalizes you for it. This is why a first priority for the ProcessWire core has always been making it well optimized and fast. In addition, we care a lot about helping our users develop sites that perform well. ProfilerPro is a new module that aims to take that to the next level.
ProfilerPro measures everything going on in your site and helps you isolate bottlenecks and other places that might need attention. ProcessWire is very flexible, but with that flexibility comes a lot of power that enables you to either develop things that run beautifully fast, or painfully slow. Sometimes it's not apparent when something is a bottleneck until a busy site launches or the combined effect of real traffic over multiple requests is observed. And there are all kinds of other factors that may come into play as well. ProfilerPro is the perfect tool to help you identify and fix those issues.
I often find myself in the position of helping people locate and fix bottlenecks on busy sites, and this tool is something I've always wished I had. While ProfilerPro is the tool to identify issues, the support board will be dedicated to helping users fix and optimize performance issues. But for now, lets look a closer look at the module itself.
ProfilerPro is built to measure live-traffic on a site, rather than just testing things out during development. It gives you an actual real picture of what's going on, rather than one from an isolated development environment. Of course, ProfilerPro will be incredibly helpful on both development and live sites, but it opens the door to observe what's happening in actuality, rather than just in testing.
By default, ProfilerPro tracks all types of events, but you can specifically enable or disable any of them on the configuration screen. Regardless of which event types you are monitoring/tracking, they are all recorded and shown in the ProfilerPro page in the admin.
When using the ProfilerPro tool in the admin, you get a real-time live view of everything going on. When a new event occurs, it shows up on the screen without you having to refresh (though we do also provide a dedicated refresh button). As a result, using ProfilerPro is not only helpful, it's incredibly fun to watch what's going on in real-time.
ProfilerPro can track both server-side and client-side events, which we'll cover separately below.
Server-side event monitoring is the primary focus of ProfilerPro, and it lets you monitor several different types of them, including the following:
For the last item above (My PHP) an easy-to-use $profiler API variable is provided which provides simple start() and stop() methods. All of the other event types are tracked automatically. We may also be adding one or two more types of server side events, in addition to these, before the module is officially released.
ProfilerPro also can monitor client-side events. Meaning, it tracks times from the visitor's browser, and then sends them back to the server, in a completely transparent manner. This is a major advantage relative to monitoring this stuff in your own browser because you get a much bigger picture that covers all users and browsers hitting your site. It identifies specifically what pages users are waiting for and makes it clear which pages might be too heavyweight in terms of javascript, images or other client-side factors. It reveals bottlenecks that could be completely missed with your own browser's development tools.
ProfilerPro monitors these types of client-side events:
JS ready: Tracks client-side time from when the browser starts parsing the HTML to when the DOM is ready.
JS load: Tracks client-side time from when the browser starts parsing the HTML to when the page is fully loaded with all assets, images, etc.
My JS: Tracks times of specific events in Javascript that you designate.
The first two events mentioned above are tracked automatically, without you having to do anything at all other than checking the box to enable it in the ProfilerPro configuration. The last event (My JS) lets you track any block of Javascript using the profiler Javascript API variable with simple start() and stop() methods.
ProfilerPro maintains a name for each event, for instance, the name of a page view event would be the page's URL and request method. The more occurrences of an event having a given name, the more accurate ProfilerPro's data becomes. With that in mind, ProfilerPro collects the following information for each event:
The first two data points mentioned above (average and total times) can also have pie or donut graphs enabled, which makes comparison at a glance a simple matter.
Of all these data points, the average execution time is generally the most useful, especially as the quantity of occurrences increases.
In our screenshots below, we are showing the first 5 data points (columns).
All of the screenshots below are taken from our ProfilerPro copy running on this site. Because we also use ProCache, most pages aren't rendered more than once an hour. Meaning, the quantities ("qty" columns) are going to reflect that. It's completely fine to use ProfilerPro in combination with ProCache, but just means that it'll take longer to collect the same data.
The Pageviews tab shows you the time required to render individual pages. The timer starts when your page starts rendering, and stops when it finishes. It gives you a good picture of what pages may be bottlenecks in your site. In the screenshot below, you can see that we've got a lot of pages in our site that are taking between 0.5 and 0.8 seconds to render. This is a bit slow, but not a major bottleneck, especially since most page views are delivered by ProCache (which has zero render time).

Nevertheless, this data makes me think I've got some optimization work to do in a few spots, especially in our sites directory. But I'll wait for more data to accumulate because some of these times may be high due to images being resized for the first time, or server-side requests to Twitter, forum RSS feeds and GitHub. Since our queries to these feeds occur hourly, and our pages are on an hourly cache, chances are those outbound http requests are occurring on most of these. So from here, I might consider turning off ProCache for a few hours to see how the data changes.
I should also mention that if I click the "AVG" column again, it will sort fastest to slowest. Most requests in the site happen in under half a second, with many under 0.2 seconds.
In this next screenshot, I've clicked the "Total" column so that I can see which pages are are consuming the most combined render time. Meaning, they are using the most server resources:

Above I can see that our /search/ page is the biggest user of time resources, consuming more than 87 seconds in total across 173 searches over the last 20 hours. This makes sense, because the /search/ page is one of the few that is never cached, since it's answering to a custom user search. The time to render each individual one was about half a second, which seems reasonable for a search page, which has to do a lot of work. While I'm not very concerned about the Search page, the data above confirms my previous conclusion that perhaps some more optimization work needs to be done in the sites directory and some other pages.
This last screenshot of the Pageviews tab shows the same view but sorted by the Quantity (QTY) column. This is particularly interesting here, as it shows our 404 page seems to be getting a lot of activity. I wonder what that's about – we'll take a closer look further down in custom "My PHP" events.

Next up is our Files tab, which shows the times consumed to render individual files. The most likely candidates are template files, but as you can see further down in the screenshot, it gets into any other files rendered by ProcessWire as well.

What we see here is that our pw-weekly.php template file takes nearly a full second to render, and that's pretty slow. But upon closer inspection, that's because it fires off an http request to weekly.pw reading its RSS feed. Given that it's only been called once in the last 8 hours (as a result of caching) we think that's okay. But with this data in hand, I'll definitely be taking a look at some of these other template files that are consuming more than half a second to render. The page.php template file seems to be our biggest resource culprit – while it's far from the slowest to render, it does appear to be the most used, and thus biggest consumer of resources with 287 seconds of server time over the last 18 hours.
The $pages tab monitors many API calls to the $pages API variable, helping you track down selectors that may not perform well. In our case, we don't appear to have any major problems here. Though I do find it particularly interesting that there have been 150 pages.find calls searching for "procache" over the last 20 hours, so I'm going to monitor that more closely in our custom (My PHP) tab.

What does it mean when a row is highlighted in yellow (like you see in many of these screenshots)? That indicates a row that just appeared in the list. Since ProfilerPro runs on it's own in real-time, it live updates the table you are viewing, and highlights the rows (in yellow) so that you can see when a new event appears.
The Hooks tab tells us the amount of time required to execute hooks in ProcessWire. This is particularly useful for tracking down auto-loading modules (3rd party or otherwise) that might be performance bottlenecks. In our case, we really don't have any bottlenecks to see here. We aren't using much in the way of 3rd party modules or custom hooks, so that explains why. We're just seeing the most common core hooks here.

Worth noting is that ProfilerPro ignores events that consume less than 0.0001 seconds (time is configurable). So if it were including those near-instant events, we'd probably have multiple paginations of data in this Hooks tab here, but it would not be worthwhile data.
The term "My PHP" is the label we use to refer to your own events that you may track with the $profiler API variable. Tracking an event is as simple as this:
$event = $profiler->start('event-name');
// execute some code in between
$profiler->stop($event);
As mentioned earlier, the previous tabs of data made us curious about searches and 404s. So we'll use custom events to monitor both. We've added this bit of code to our search.php template file:
// The $q variable contains our sanitized search text
$event = $profiler->start("Search: $q");
// perform the find
$items = $pages->find("body~=" . $sanitizer->selectorValue($q));
// stop the event timer
$profiler->stop($event);
After letting that run for a few hours, here's what our "My PHP" tab looks like:

Interesting, there really are a lot of searches for "procache", like we found on or $pages tab. This confirms that those are actual searches on the search page and not some other API activity from a module or the like. Why are there so many searches for ProCache? I don't yet know, but I'll probably be going to the server logs next. Outside of this, the rest of the searches look pretty normal.
Next, I added this bit of code to the template file used by our 404 page:
$url = $sanitizer->text($_SERVER['REQUEST_URI']);
$event = $profiler->start("404: $url");
// render the 404 output, then stop the event
$profiler->stop($event);
I don't really care much about the render time here, what I'm really interested in are the actual URLs responsible for the 404s. This could be helpful in determining if there's something missing that I've neglected. Here's what turned up after letting it run for 18 hours:

Well this is certainly interesting. The vast majority of those 404s are hits to a wp-login.php URL. I feel sorry for those poor users that are looking for some kind of login and getting a 404 instead. Now that I know we aren't properly serving all these people, I setup a proper login form for them, rather than waste ProcessWire's time with answering to all those 404s… Take it for a spin: http://processwire.com/wp-login.php
Now we move to client side events, with the JS tab. This tracks client-side time from when the browser starts parsing the HTML to when the DOM is ready. And more importantly, it also tracks the client-side time from when the browser starts parsing the HTML to when the page is fully loaded with all assets, images, etc.
Basically, this tells you exactly how long users are waiting for your page to be fully loaded in their browser. Pages that take a long time to load are far more likely to lose users, so this can be an important thing to pay attention to. Even if your server-side delivery is instant, if the front-end part of your performance is slow, then the server side performance means little.

With these numbers, you want to have a pretty large quantity for a given event before you determine there is a problem. That's because it represents all the people hitting your site. Some will have slower computers and connections than others. But in the end, your sites are there for the visitors, and this tells you how long your visitors are waiting for the page to render on their computer, so it's an important metric, especially as the quantity increases.
In our screenshot above, the first two rows have apparent 5+ second client-side load times, which seems a little slow. But that's the combined average among only 3 and 5 requests. So my next step would be to test the page out myself in my browser to see if there are any apparent issues. If nothing is obvious, I'll wait to see if that average load time remains after there have been a lot more requests to the page. For instance, look at the homepage, which has an average of 2.1 seconds load time among 571 requests – I can feel confident that's an accurate number, given the quantity. I'm also satisfied with that 2.1 second load time for the homepage.
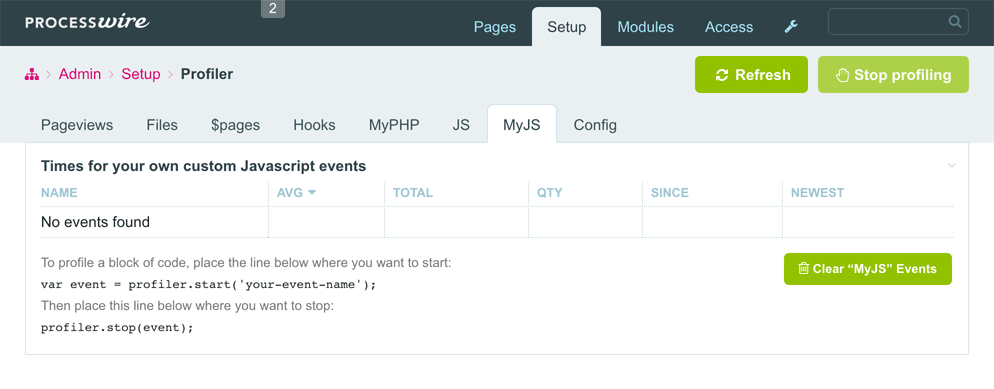
This is just like the "My PHP" tab, except that it tracks custom Javascript blocks of code, rather than PHP. The API works the same, except of course that it uses Javascript code syntax rather than PHP. You don't actually need to add any new script references to your template file(s), as ProfilerPro adds them automatically for you when the profiler is active. The only thing you need to do is start() and stop(), as in the code example that's part of the screenshot below. I don't have any events to show you in this particular screenshot as I'm not tracking any yet on processwire.com. But I figure you've got a pretty good picture of what they would look like, given all the screenshots above.
The last screenshot I have for you is the configuration tab. This is where you can specify what you want to track and how you want it to appear in the admin tool.

ProfilerPro will be released as part of the ProDevTools module group, likely in the next week or two. It will require ProcessWire 3.0.40 or newer. The ProfilerPro module is actually production ready at this point, but I'd like to test it out on a few more of my sites before releasing it, just to be sure. This also gives me some time to write more documentation for it.
The ProDocs module is nearly done as well, and I'll include some coverage of that next week along with ProcessWire 3.0.41. If there are other new tools that you think would be helpful in the ProDevTools group of modules, please let me know too, as I definitely plan to add more as we go.
Like ProFields, the ProDevTools modules will just come in a developer edition, as these modules are things you'll likely want to use on most sites you develop (at least I know I will). Further, they aren't modules you necessarily need to leave installed long term either, so there's little reason to have single-site edition.
In terms of cost, this will be priced less than something like ProFields since the number of modules will initially only be two. However, ProDevTools (and especially ProfilerPro) are also about supporting you one-on-one in our support board to fix issues in your site after the module finds them. You can export your results to a CSV in ProfilerPro, and this helps me to get an accurate picture of what's going on and improvements we can make. I can help you find new ways to approach development to increase performance, which has always been one of my favorite topics.
Thanks for reading and hope that you all have a great weekend. Enjoy reading the ProcessWire Weekly this weekend too.
New master and dev versions released, more coverage of what you can do with the new Functions API, plus a couple useful tips and tricks. More
Covers updates in our master version 3.0.41, plus a look at the new the API Explorer module. More
“We chose ProcessWire because of its excellent architecture, modular extensibility and the internal API. The CMS offers the necessary flexibility and performance for such a complex website like superbude.de. ProcessWire offers options that are only available for larger systems, such as Drupal, and allows a much slimmer development process.” —xport communication GmbH
adrian
- 7 years ago
- 102
★★★★★I am going to like first :)
Reply
LostKobrakai
For background jobs take a look at this one: https://processwire.com/blog/posts/introducing-iftrunner-and-the-story-behind-it/
or
http://modules.processwire.com/modules/wire-queue/
Reply
Michael Murphy
Hi Benjamin, I have tried these, and ideally it would be something that combines them both, and ListerPro type actions into a simple unified way of managing any type of long running or scheduled task while developing projects in Processwire.
If we are focusing on performance improvements, imagine if there was a simple way to handle any long running tasks for end users (like generating a report, contacting an external service for data), and it was as simple as adding a few lines (like Ryan showed above for doing the custom event profile timers), which then automatically generates a nice “loading” message for the users, and then replaces it with the completed task when done, then maybe more developers would start to use this type of functionality in their projects. This would be a gain to their users (no waiting for pages to finish loading while tasks are done), and possibly open up the door to building much more advanced applications not to mention all the time saved managing other tasks that are typically needed in most projects (maintenance tasks, backups, importing / exporting data etc).
If you can simplify an advanced technique like queueing background jobs / task management to the same level that ProCache simplified advanced caching techniques, and how this ProfilerPro looks to have simplified performance monitoring, then I am sure many developers would be interested.
Reply
Peter
Perfect timing. I've a site at the moment which badly needs this to track down some bottlenecks.
Reply
Bernhard
i commented on this in the forum's post to this blog-post
https://processwire.com/talk/topic/14754-blog-post-a-look-at-the-new-profilerpro-module/?do=findComment&comment=132491
Reply
Tom
- 7 years ago
- 52
★★★★★Instant purchase for me :)
Reply
Stevie
- 7 years ago
- 22
★★★★★nice things!
Reply
Michael Murphy
- 7 years ago
- 52
★★★★★It’s great that you are focusing on some pro tools to help make developers even more productive and efficient. Very interested to hear more about the ProDocs (I’m hoping its a something to do with building good documentation for clients and other developers and designers…)
One idea for extending the JS profiler on the ProfilerPro module, would be to log stack traces to help track client side errors - there are many commercial services that do this (like errorception and sentry.io) but you might be able do something similar with a library like TraceKit https://github.com/csnover/TraceKit
I have many ideas (wishes) for other pro tools that would save me a lot of time during development, especially in the areas of deployment (moving from local development to production environments, tracking and merging field/template/module changes), importing and exporting content (maybe not a module with a UI but some robust helper files to speed this up), easily running and scheduling background jobs (queues for importing/exporting data, generating / sending reports and emails, backups etc.), faster setup time for local development and testing (imagine a one command, 20 second installation with a combined web server+DB, using something like Valet). Some of these idea might not be actual modules with a UI, but more helper files, scripts and processes that are well tested and supported.
Reply
Sérgio Jardim
- 7 years ago
- 32
★★★★★Top notch work, Ryan!! Instant purchase for me as well!
Reply
Grimezy
- 7 years ago
- 42
★★★★★Great post and great module Ryan.
Also, always nice to have a bit of a laugh starting off the weekend. Had a bit of a chuckle with your custom WP Login page. :)
Reply
Renobird
- 7 years ago
- 41
★★★★★Fantastic! Will be tremendously helpful. I can't wait to try it.
Reply
Mike Rockett
- 7 years ago
- 11
★★★★★This is fantastic! Very well done, Ryan!
Reply
flydev
ahahah the wp-login !
Reply
Peter
Can we get early access? ????
Reply